Download
1 / 33
330 likes | 477 Views
NEPOOL Objective Capability (Installed Capacity Requirement) For Power Year 2005/2006. Presentation to the NEPOOL Power Supply Planning Committee January 28, 2005 Holyoke, MA. Background.

E N D
NEPOOL Objective Capability(Installed Capacity Requirement)For Power Year 2005/2006 Presentation to the NEPOOL Power Supply Planning Committee January 28, 2005 Holyoke, MA
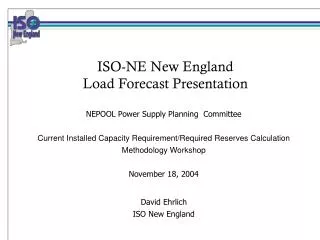
Background NEPOOL Objective Capability (OC) is the amount of installed capacity that NE needs to meet the NEPOOL resource planning reliability criterion of 1 day in 10 years disconnection of non-interruptible customers. This criterion takes into account: • Possible levels of peak loads due to weather variations, • Impact of assumed generating unit performance, and • Possible load and capacity relief obtainable through the use ofISO-NE Operating Procedure no. 4 – Action During a Capacity Deficiency. ISO NEW ENGLAND | The people behind New England’s power
Background (Cont’d) • OC is established by NEPOOL on an annual basis one year at a time. • Power Supply Planning Committee – reviews assumptions and develop OC scenario(s) for Reliability Committee (RC) consideration. • RC reviews the OC scenario(s) and votes a recommendation(s) for Participants Committee approval. ISO NEW ENGLAND | The people behind New England’s power
Background (Cont’d) OC is calculated using the single area Westinghouse/ABB Capacity Model Program. Single area refers to the assumption that there is adequate transmission to deliver capacity where and when is needed. Simply said, all loads and generators are assumed to be connected to a single electric bus. ISO NEW ENGLAND | The people behind New England’s power
Background (Cont’d) The Capacity Model uses probabilistic calculation that simulates the availability of system resources (taking into account each generating unit’s assumed forced outages and maintenance requirements) to meet the expected load (taking into account possible variations due to weather). This calculation is often referred to as the Loss of Load Expectation (LOLE) calculation. ISO NEW ENGLAND | The people behind New England’s power
Capacity Outage Calculation Two Identical Units – 100 MW RatingEquivalent Forced Outage Rate = 0.10 Assuming that the load is 100 MW, then the probability of not being able to serve the load is 0.01 ISO NEW ENGLAND | The people behind New England’s power
Capacity Outage Calculation (Cont’d) Three Identical Units – 50 MW RatingEquivalent Forced Outage Rate = 0.05 Assuming that the load is 100 MW, then the probability of not being able to serve the load is 0.00715 + 0.000125 = 0.00725 ISO NEW ENGLAND | The people behind New England’s power
Capacity Outage Calculation (Cont’d) Four Identical Units – 50 MW Rating Equivalent Forced Outage Rate = 0.05 Assuming that the load is 100 MW, then the probability of not being able to serve the load is 0.000475 + 0.00000625 = 0.0004813 ISO NEW ENGLAND | The people behind New England’s power
Assumptions For 2005/06 OC Calculations ISO NEW ENGLAND | The people behind New England’s power
Loads Capacity Existing Additions Attrition Purchases and Sales Daily Cycle Hydro Ratings ICAP Capable Load Response Program Assets SWCT RFP Unit Availability Tie Benefits Other OP-4 Load Relief Assumptions ISO NEW ENGLAND | The people behind New England’s power
Loads • Based on CELT 2005 forecast • Weekly distributions represented with: • Expected value (mean) • Standard deviation • Skewness • Based on short-run seasonal peak load forecast • Summer peak = 26,355 MW • Winter peak = 22,830 MW ISO NEW ENGLAND | The people behind New England’s power
Capacity • Existing Capacity • Based on 2005 CELT Data • Assets within January 2005 Seasonal Claimed Capability (SCC) Report • Summer Rating – August 2004 SCC Report • Winter Rating – January 2005 SCC Report • Units categorized as “EMS” & “SO” units included • Energy Management System = 30,516 MW (S) & 32,878 MW (W) • Settlement Only resources = 238 MW (S) & 313 MW (W) ISO NEW ENGLAND | The people behind New England’s power
Capacity • Capacity Additions • Ridgewood Generation (8.4 MW) • Kendall Steam 3 Reactivation (25 MW) • Kendall CT Reactivation (158 MW) • Capacity Attrition • No attrition assumed ISO NEW ENGLAND | The people behind New England’s power
Capacity • Purchases and Sales • Purchases and Sales as reported in 2004 CELT Report (453 MW) • Daily Cycle Hydro Ratings • 50 Percentile value of daily flows assumed with adjustment (59 MW in July) to OC. ISO NEW ENGLAND | The people behind New England’s power
Load Response Assumptions • ICAP Capable Load Response Program • All capacity listed as of January 1, 2005 as “ready to respond” enrolled in: • Day-Ahead Demand Response Program • Real-Time Demand Response Program • Real-Time Profiled Response Program • Assets grouped by Program and Area • Assets assumed to have performance factors based on August 20, 2004 audit results and NERC Class Average EFORd values for known emergency generation. ISO NEW ENGLAND | The people behind New England’s power
Assumed MW from Load Response Program EFOR values based on Aug. 20, 2004 audit results and NERC Class average data [1]Calculated using a Capacity weighted average of the August 20, 2004 performance audit results(non emergency generation capacity) and the NERC Class average EFORd value of 7.45% ISO NEW ENGLAND | The people behind New England’s power
Emergency Resources • SWCT RFP • Contracted SWCT RFP resources not currently enrolled in Real-Time Demand Response included • 218 MW total contracted for summer 2005 ISO NEW ENGLAND | The people behind New England’s power
Equivalent Forced Outage Hours EFOR = • (Period Hours – Scheduled Outage Hours) • PSPC recommended using EFORd instead of EFOR to be consistent with EFORd’s application in the ICAP market and the UCAP rating for generating units. ISO NEW ENGLAND | The people behind New England’s power
EFORd Equation Where: ISO NEW ENGLAND | The people behind New England’s power
EFORd - Equivalent Demand Forced Outage Rate • ff- full f-factor • fp- partial f-factor • FOH - Full Forced Outage Hours • EFOH - Equivalent Full Forced Outage Hours: Sum of all hours a unit was involved in an outage expressed as equivalent hours of full forced outage at its maximum net dependable capability • SH - Service Hours: The time a unit is electrically connected to the system - Sum of all Unit Service Hours. • AH - Available Hours: The time a unit is capable of producing energy, regardless of its capacity level -- Sum of all Service Hours + Reserve Shutdown Hours + Pumping Hours + Synchronous Condensing Hours • RSH - Reserve Shutdown Hours: The time a unit is available for service but not dispatched due to economic or other reasons ISO NEW ENGLAND | The people behind New England’s power
Equiv. Forced Outage Rate – Demand (EFORd) • Interpretation: • The probability that a unit will not meet itsdemand periods for generating requirements. • Best measure of reliability for all loading types(base, cycling, peaking, etc.) • Best measure of reliability for all unit types(fossil, nuclear, gas turbines, diesels, etc.) • For demand period measures and not for thefull 24-hour clock. ISO NEW ENGLAND | The people behind New England’s power
Unit Availability Assumption • 5-year average EFORd modeled • Forced Outage Rates (EFORd) determined using combination of NERC Class Average EFORd data and available New England GADs data. • NERC Class Average used Jan’00 – Feb’03 • Calculated EFORd using GADs used Mar’03 – Dec ’04 • Since Dec 04 data is not yet available,Dec 03 data is used for Dec 04. ISO NEW ENGLAND | The people behind New England’s power
Unit Availability • New England Nuclear units performance not correctly represented by NERC Class Average EFORd • For Nuclear units, used ISO-NE calculated Jan’00 through Feb’03 EFOR and Mar’03 through Dec’04 EFORd. • Since Dec 04 data is not yet available,Dec 03 data is used for Dec 04. ISO NEW ENGLAND | The people behind New England’s power
Results of 60-Month Average ISO NEW ENGLAND | The people behind New England’s power
Tie Reliability Benefits • Tie Reliability Benefits from Hydro-Quebec, New Brunswick, and New York are modeled in the Westinghouse Capacity Model as Resources • PSPC suggested two sets of tie benefits assumptions • 1,400 MW (summer values including HQICC) • 2,000 MW (summer values including HQICC) ISO NEW ENGLAND | The people behind New England’s power
Tie Reliability Benefits - HQICC • Hydro-Quebec Interconnection Capability Credits for 2005/06 are determined based on load and capacity data submitted to ISO-NE by Hydro-Quebec Distribution and Hydro-Quebec Production. • The monthly HQICC values recommendedby ISO-NE are: • June through November, March and May – 1,200 MW • December through February – 0 MW ISO NEW ENGLAND | The people behind New England’s power
OP-4 Load Relief • Load Relief values based on ISO-NE Operating Procedure No. 4 (OP-4) • 5% Voltage Reduction is based on 1.5% of the seasonal peak load as determined by Spring Voltage Reduction Test Results ISO NEW ENGLAND | The people behind New England’s power
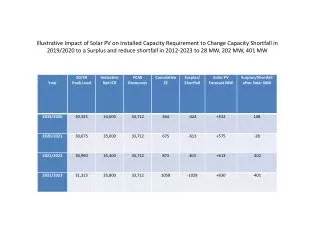
Tie Reliability Benefits Scenarios The PSPC suggested calculating NEPOOL OC for 2005/06 Power year with two sets of tie reliability benefits assumptions. The results are: ISO NEW ENGLAND | The people behind New England’s power
Table 1 - 05/06 OC Values Assuming 2,000 MW Tie Benefits 2005-2006 Power Year Objective Capability (OC)January 28, 2005 ISO NEW ENGLAND | The people behind New England’s power
Table 2 - 05/06 OC Values Assuming 1,400 MW Tie Benefits 2005-2006 Power Year Objective Capability (OC)January 28, 2005 ISO NEW ENGLAND | The people behind New England’s power
ISO-NE OC Recommendation ISO-NE recommends that the NEPOOL Objective Capability for the Power Year commencing on June 1, 2005 and ending on May 31, 2006 be those from Table 1, developed using 2,000 MW of tie reliability benefits (including HQICC). ISO NEW ENGLAND | The people behind New England’s power