
Decision Trees in Data Mining and Classification
E N D
Presentation Transcript
Outline • Introduction: Data Mining and Classification • Classification • Decision trees • Splitting attribute • Information gain and gain ratio • Missing values • Pruning • From trees to rules
Trends leading to Data Flood • More data is generated: • Bank, telecom, other business transactions ... • Scientific Data: astronomy, biology, etc • Web, text, and e-commerce
Data Growth • Large DB examples as of 2003: • France Telecom has largest decision-support DB, ~30TB; AT&T ~ 26 TB • Alexa internet archive: 7 years of data, 500 TB • Google searches 3.3 Billion pages, ? TB • Twice as much information was created in 2002 as in 1999 (~30% growth rate) • Knowledge Discovery is NEEDED to make sense and use of data.
Machine Learning / Data Mining Application areas • Science • astronomy, bioinformatics, drug discovery, … • Business • advertising, CRM (Customer Relationship management), investments, manufacturing, sports/entertainment, telecom, e-Commerce, targeted marketing, health care, … • Web: • search engines, bots, … • Government • law enforcement, profiling tax cheaters, anti-terror(?)
Classification Application: Assessing Credit Risk • Situation: Person applies for a loan • Task: Should a bank approve the loan? • Note: People who have the best credit don’t need the loans, and people with worst credit are not likely to repay. Bank’s best customers are in the middle
Credit Risk - Results • Banks develop credit models using variety of machine learning methods. • Mortgage and credit card proliferation are the results of being able to successfully predict if a person is likely to default on a loan • Widely deployed in many countries
Classification example:Making diagnosis from DNA data Given DNA microarray data for a number of samples (patients), we can in many cases • Accurately diagnose the disease • Predict likely outcome for given treatment • Coming Soon: • Recommend best treatment • Personalized medicine
Example: ALL/AML Leukemia data • 38 training cases, 34 test, ~ 7,000 genes • 2 Classes: Acute Lymphoblastic Leukemia (ALL) vs Acute Myeloid Leukemia (AML) • Uses train data to build diagnostic model ALL AML • Results on test data better than human expert • 33/34 correct (1 error may be mislabeled)
Classification • Classification is a most common machine learning and data mining task. • Given past “classified” cases, and a new “unclassified” case, learn a model that fits past cases and predicts the class of the new case. • Decision Trees are one of most common methods to build a model • Applications: Diagnostics, Prediction in medicine, business, science, etc …
Weather Data: Play or not Play? Note: Outlook is the Forecast, no relation to Microsoft email program
Example Tree for “Play?” For Outlook=sunny, Humidity=normal, Windy=true Play = ? Outlook sunny rain overcast Yes Humidity Windy high normal false true No Yes No Yes
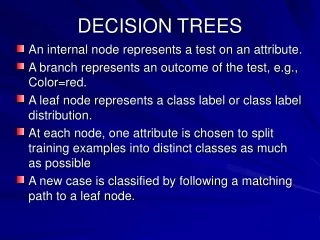
DECISION TREE • An internal node is a test on an attribute. • A branch represents an outcome of the test, e.g., Color=red. • A leaf node represents a class label or class label distribution. • At each node, one attribute is chosen to split training examples into distinct classes as much as possible • A new case is classified by following a matching path to a leaf node.
Building A Decision Tree • Top-down tree construction • At start, all training examples are at the root. • Partition the examples recursively by choosing one attribute each time. • Bottom-up tree pruning • Remove sub-trees or branches, in a bottom-up manner, to improve the estimated accuracy on new cases.
Choosing the Splitting Attribute • At each node, available attributes are evaluated on the basis of separating the classes of the training examples. A goodness function is used for this purpose. • Typical goodness functions: • information gain (ID3/C4.5) • information gain ratio • gini index
Which attribute to select? witten&eibe
A criterion for attribute selection • Which is the best attribute? • The one which will result in the smallest tree • Heuristic: choose the attribute that produces the “purest” nodes • Popular impurity criterion: information gain • Information gain increases with the average purity of the subsets that an attribute produces • Strategy: choose attribute that results in greatest information gain witten&eibe
Computing information • Information is measured in bits • Given a probability distribution, the info required to predict an event is the distribution’s entropy • Entropy gives the information required in bits (this can involve fractions of bits!) • Formula for computing the entropy: witten&eibe
Example: attribute “Outlook” • “Outlook” = “Sunny”: • “Outlook” = “Overcast”: • “Outlook” = “Rainy”: • Expected information for attribute: Note: log(0) is not defined, but we evaluate 0*log(0) as zero witten&eibe
Computing the information gain • Information gain: (information before split) – (information after split) • Information gain for attributes from weather data: witten&eibe
Continuing to split witten&eibe
The final decision tree • Note: not all leaves need to be pure; sometimes identical instances have different classes Splitting stops when data can’t be split any further witten&eibe
Highly-branching attributes • Problematic: attributes with a large number of values (extreme case: ID code) • Subsets are more likely to be pure if there is a large number of values • Information gain is biased towards choosing attributes with a large number of values • This may result in overfitting (selection of an attribute that is non-optimal for prediction)
Split for ID Code Attribute Entropy of split = 0 (since each leaf node is “pure”, having only one case. Information gain is maximal for ID code
Gain ratio • Gain ratio: a modification of the information gain that reduces its bias on high-branch attributes • Gain ratio should be • Large when data is evenly spread • Small when all data belong to one branch • Gain ratio takes number and size of branches into account when choosing an attribute • It corrects the information gain by taking the intrinsic information of a split into account (i.e. how much info do we need to tell which branch an instance belongs to)
Gain Ratio and Intrinsic Info. • Intrinsic information: entropy of distribution of instances into branches • Gain ratio (Quinlan’86) normalizes info gain by:
Computing the gain ratio • Example: intrinsic information for ID code • Importance of attribute decreases as intrinsic information gets larger • Example of gain ratio: • Example:
Gain ratios for weather data witten&eibe
More on the gain ratio • “Outlook” still comes out top • However: “ID code” has greater gain ratio • Standard fix: ad hoc test to prevent splitting on that type of attribute • Problem with gain ratio: it may overcompensate • May choose an attribute just because its intrinsic information is very low • Standard fix: • First, only consider attributes with greater than average information gain • Then, compare them on gain ratio witten&eibe
Discussion • Algorithm for top-down induction of decision trees (“ID3”) was developed by Ross Quinlan • Gain ratio just one modification of this basic algorithm • Led to development of C4.5, which can deal with numeric attributes, missing values, and noisy data • Similar approach: CART (to be covered later) • There are many other attribute selection criteria! (But almost no difference in accuracy of result.)
Outline • Handling Numeric Attributes • Finding Best Split(s) • Dealing with Missing Values • Pruning • Pre-pruning, Post-pruning, Error Estimates • From Trees to Rules
Industrial-strength algorithms • For an algorithm to be useful in a wide range of real-world applications it must: • Permit numeric attributes • Allow missing values • Be robust in the presence of noise • Be able to approximate arbitrary concept descriptions (at least in principle) • Basic schemes need to be extended to fulfill these requirements witten & eibe
C4.5 History • ID3, CHAID – 1960s • C4.5 innovations (Quinlan): • permit numeric attributes • deal sensibly with missing values • pruning to deal with for noisy data • C4.5 - one of best-known and most widely-used learning algorithms • Last research version: C4.8, implemented in Weka as J4.8 (Java) • Commercial successor: C5.0 (available from Rulequest)
Numeric attributes • Standard method: binary splits • E.g. temp < 45 • Unlike nominal attributes,every attribute has many possible split points • Solution is straightforward extension: • Evaluate info gain (or other measure)for every possible split point of attribute • Choose “best” split point • Info gain for best split point is info gain for attribute • Computationally more demanding
Example • Split on temperature attribute: • E.g. temperature 71.5: yes/4, no/2 temperature 71.5: yes/5, no/3 • Info([4,2],[5,3])= 6/14 info([4,2]) + 8/14 info([5,3]) = 0.939 bits • Place split points halfway between values • Can evaluate all split points in one pass!
Avoid repeated sorting! • Sort instances by the values of the numeric attribute • Time complexity for sorting: O (n log n) • Q. Does this have to be repeated at each node of the tree? • No! Sort order for children can be derived from sort order for parent • Time complexity of derivation: O (n) • Drawback: need to create and store an array of sorted indices for each numeric attribute
X More speeding up • Entropy only needs to be evaluated between points of different classes (Fayyad & Irani, 1992) value class Potential optimal breakpoints Breakpoints between values of the same class cannot be optimal
Missing as a separate value • Missing value denoted “?” in C4.X • Simple idea: treat missing as a separate value • Q: When this is not appropriate? • When values are missing due to different reasons • Example 1: gene expression could be missing when it is very high or very low • Example 2: field IsPregnant=missing for a male patient should be treated differently (no) than for a female patient of age 25 (unknown)
Missing values - advanced Split instances with missing values into pieces • A piece going down a branch receives a weight proportional to the popularity of the branch • weights sum to 1 • Info gain works with fractional instances • use sums of weights instead of counts • During classification, split the instance into pieces in the same way • Merge probability distribution using weights
Pruning • Goal: Prevent overfitting to noise in the data • Two strategies for “pruning” the decision tree: • Postpruning - take a fully-grown decision tree and discard unreliable parts • Prepruning - stop growing a branch when information becomes unreliable • Postpruning preferred in practice—prepruning can “stop too early”
Prepruning • Based on statistical significance test • Stop growing the tree when there is no statistically significant association between any attribute and the class at a particular node • Most popular test: chi-squared test • ID3 used chi-squared test in addition to information gain • Only statistically significant attributes were allowed to be selected by information gain procedure
Early stopping • Pre-pruning may stop the growth process prematurely: early stopping • Classic example: XOR/Parity-problem • No individual attribute exhibits any significant association to the class • Structure is only visible in fully expanded tree • Pre-pruning won’t expand the root node • But: XOR-type problems rare in practice • And: pre-pruning faster than post-pruning
Post-pruning • First, build full tree • Then, prune it • Fully-grown tree shows all attribute interactions • Problem: some subtrees might be due to chance effects • Two pruning operations: • Subtree replacement • Subtree raising • Possible strategies: • error estimation • significance testing • MDL principle
Subtree replacement • Bottom-up • Consider replacing a tree only after considering all its subtrees • Ex: labor negotiations
Estimating error rates • Prune only if it reduces the estimated error • Error on the training data is NOT a useful estimatorQ: Why it would result in very little pruning? • Use hold-out set for pruning(“reduced-error pruning”) • C4.5’s method • Derive confidence interval from training data • Use a heuristic limit, derived from this, for pruning • Standard Bernoulli-process-based method • Shaky statistical assumptions (based on training data)