Download
1 / 13
130 likes | 167 Views
Investigating shift in river flow patterns due to changing precipitation in Western U.S. using historical data and simulations. Impacts on energy production and drought severity examined.

E N D
Changing Precipitation Statistics in the West, and Evidence of Frequency of Recurrence from Paleoclimatic Streamflow Reconstructions • Alan F. Hamlet • Anthony L. Westerling • Tim P. Barnett • Dennis P. Lettenmaier • JISAO/CSES Climate Impacts Group • Dept. of Civil and Environmental Engineering • University of Washington • Scripps Institute of Oceanography • School of Engineering, University of California, Merced
Cool Season Precipitation Explains Most of the Variability in Annual Flow in the PNW and CA R2 = 0.83 Relationship Between Annual Flow and Cool Season Precip. Columbia River R2 = 0.91 Relationship Between Annual Flow and Cool Season Precip. Sacramento River
Cool Season Precip Explains Most of the Variability in Annual Flow in the CRB, but the Summer Monsoon Also Plays a Role R2 = 0.56 Relationship Between Annual Flow and Cool Season Precip. Colorado River R2 = 0.18 Relationship Between Annual Flow and Warm Season Precip. Colorado River
Regionally Averaged Cool Season Precipitation Anomalies PRECIP
Regionally Averaged Warm Season Precipitation Anomalies PRECIP
Severe Multi-Year Drought Impacts Associated with Changing Precipitation Statistics • Severe 8-Year Drought in the Colorado Basin and Southwest • Unprecedented 5-year drought in Idaho • Current severe multi-year drought in California (following a severe extended drought in the 1990s).
Simulated Changes in System Wide Energy Production in the Western U.S. Correlation: CRB-SSJ = 0.07 CRB-PNW = 0.08 SSJ-PNW = 0.36 Correlation: CRB-SSJ = 0.14 CRB-PNW = -0.14 SSJ-PNW = 0.06 Correlation: CRB-SSJ = 0.73 CRB-PNW = 0.51 SSJ-PNW = 0.65
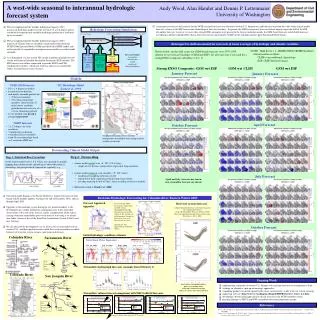
Long-Term Comparison of Annual Flow Records from Observations and Paleo Reconstructions PNW: Observed (naturalized) annual flow in the Columbia River at The Dalles, OR 1858-1877 (reconstructed from observed peak river stage) 1878-2003 (naturalized from observed monthly records) CA: Reconstructed combined annual flow in the Sacramento/San Joaquin basin from tree-ring records. (Overlapping period 1858-1977) (Meko, D.M., 2001: Reconstructed Sacramento River System Runoff From Tree Rings, Report prepared for the California Department of Water Resources, July) Colorado River Basin: Reconstructed annual flow in the Colorado River at Lees Ferry, AZ from tree ring records. (Overlapping period 1858-1977) (Woodhouse, C.A., S.T. Gray, and D.M. Meko, 2006: Updated Streamflow Reconstructions for the Upper Colorado River Basin, Water Resources Research, Vol. 42, W05415)
Changes in Streamflow Variability from Combined Paleo Reconstructions (black) and VIC Simulations (red) of Annual Flow All three metrics high together
Changes in Streamflow Variability from Combined Paleo Reconstructions (black) and VIC Simulations (red) of Annual Flow for the SSJ and Colorado Basins Only ~1580 ~1780 ~1980
Conclusions • Cool season precipitation is a major driver of annual river flow and hydropower production in the Western U.S. • Substantial and persistent changes in cool season precipitation variability have emerged over the West since about 1975, including increased CV, within-region persistence, and inter-regional correlation. • Long-term streamflow reconstructions show that the current changes in variability are very unusual in the context of natural variations over the last 150 years or so, but have probably occurred before in about 1580, and again in about 1780 (almost exactly once every 200 years!) • Is there a component of the most recent long-term droughts that is also related to global warming?