Theme 5 Standard Deviations and Distributions
130 likes | 142 Views
Learn about the distribution of data and the importance of normal distribution. Explore skewness, kurtosis, and standard deviation. Calculate z-scores using SD.

Theme 5 Standard Deviations and Distributions
E N D
Presentation Transcript
Overview You should examine the way in which your data on a given variable is distributed This is important because many statistical tests assume a ‘normal distribution’ Skewness considers whether the data is mostly to the left, right or central Kurtosis considers whether the distribution is particularly flat or steep Standard deviation is the variability of the data and is a standard unit of measurement
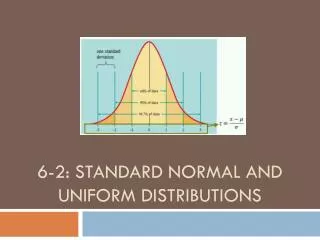
A Normal Distribution Figure 6.1 The normal distribution
A Skewed Distribution Figure 6.2 An example of a skewed distribution
A Flat Distribution Figure 6.3 A flat frequency distribution
A Steep Distribution Figure 6.4 A steep frequency distribution
A Frequency Curve Figure 6.5 A histogram with more data points, making frequency curve fitting a little easier
Influence of Distribution Shape on Tests of Significance Figure 6.6 The influence of distribution shapes on tests of significance
Standard Deviation (SD) The SD is the standard unit of measurement in statistics The SD is simply the average amount that the scores on a variable deviate (or differ) from the mean of the set of scores The SD is the square root of the variance Data can be transformed into z-scores
Calculating SD Figure 7.2 Steps in standard deviation
Calculating SD using SPSS Data In Variable View of the Data Editor, ‘name’ the variables In Data View of the Data Editor, enter the data under the appropriate variable names Analysis Select ‘Analyze’, ‘Descriptive Statistics’ and ‘Descriptives...’ Move the variables to be analysed to the ‘Variable(s):’ box Select ‘Save standardised values as variables’ Output The standard deviation is presented in a table with other default statistics unless these are de-selected
Z-Scores This is calculated by subtracting the mean from a given value and then dividing this by the SD Imagine the mean IQ in a class is 100 and the SD is 10 A student with an IQ of 120 would have a z-score of (120-100)/10 = 2 In other words, he/she is 2 SDs above the mean Note that all z-scores will have a mean of 0 and an SD of 1
Conclusion It is important to study the shape of the distribution of each of your variables For most statistical techniques, a symmetrical ‘bell-shaped’ distribution is ideal You should be wary when working with variables which have highly asymmetrical distributions SD assesses variability in the data that can then be converted to z-scores