Download
1 / 34
340 likes | 456 Views
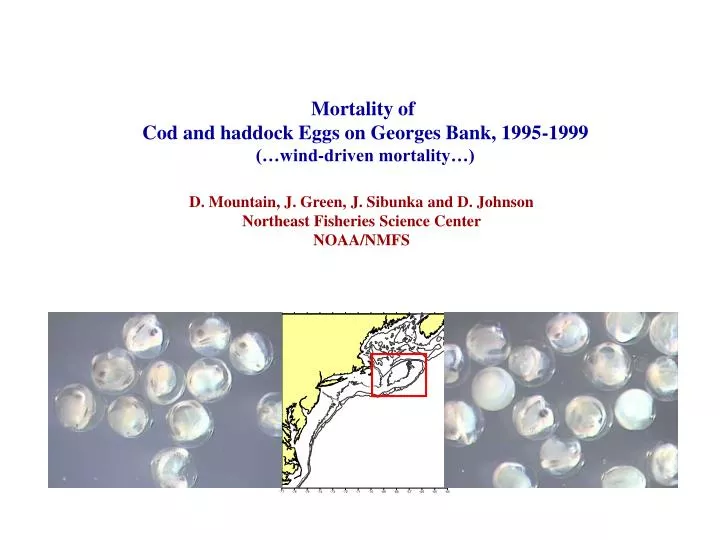
Mortality of Cod and haddock Eggs on Georges Bank, 1995-1999 (…wind-driven mortality…). D. Mountain, J. Green, J. Sibunka and D. Johnson Northeast Fisheries Science Center NOAA/NMFS. 1. Vertically integrated Sampling for eggs 2. Cod and haddock egg abundance by stage

E N D
Mortality of Cod and haddock Eggs on Georges Bank, 1995-1999 (…wind-driven mortality…) D. Mountain, J. Green, J. Sibunka and D. Johnson Northeast Fisheries Science Center NOAA/NMFS
1. Vertically integrated Sampling for eggs 2. Cod and haddock egg abundance by stage for each survey 3. Peak abundance Cod: mid-Feb to mid-Apr Haddock: mid-Mar to mid-May Cod early stage eggs, February 1997
Egg Mortality Rate – percent per day Determined from difference in number of early and late stage eggs over the whole season. (exponential decrease over period of average development time)
Egg Mortality Rate – percent per day Determined from difference in number of early and late stage eggs over the whole season. (exponential decrease over period of average development time) 1997 – high mortality rate 1998 – low mortality rate With a 17 day incubation time, egg survival rate 3 to 8times higher in 1998
Variation in Egg Mortality 1. What caused it? 2. What are it implications for recruitment?
What caused the interannual variation in mortality rate? 1. Egg viability? (i.e., maternal factors) 2. Predation? 3. Wind Driven Transport off the Bank?
SE Wind Stress vs Egg Mortality Rate 1. Winds from Georges Bank Buoy 2. No winds for 1996 3. Average SE wind stress: mid-Feb to mid-Apr for cod mid-Mar to mid-May for haddock Cod R2 = 0.81 Mortality rate (ppd) Haddock R2 = 0.58 SE wind stress (pascals)
SE Wind Stress vs Egg Mortality Rate 1. Winds from Georges Bank Buoy 2. No winds for 1996 3. Average SE wind stress: mid-Feb to mid-Apr for cod mid-Mar to mid-May for haddock Cod R2 = 0.81 Mortality rate (ppd) Relationship to SE winds suggests transport is associated with time- dependent winds (i.e., episodic forcing) Haddock R2 = 0.58 SE wind stress (pascals)
Could wind driven transport actually have caused the interannual variability in egg mortality? (Was the temporal/spatial variability in the egg locations and in the wind forcing likely to have resulted in the observed mortality?)
Could wind driven transport actually have caused the interannual variability in egg mortality? (Was the temporal/spatial variability in the egg locations and in the wind forcing likely to have resulted in the observed mortality?) Use particle tracking model to test this. Two issues: 1. Estimating the currents 2. The egg distributions to be used
Currents: 1. Climatological flow fields from US GLOBEC models (3-D finite element model with mean winds; bi-monthly) 2. Time-dependent Ekman current, using observed winds (48 hour wind history) 3. Random displacement – for dispersion 4. Particle tracking by ‘Drogue-3D’ by B. Blanton – hourly time step Caveats: Adding climatology and Ekman not a fully rigorous approach Considering only near surface drift
Test of the Ekman current approach Using satellite tracked drifters, drogued at 10m depth Three examples where drift track changed direction with a major wind event. Red (‘D’) is drifter; Green (‘C’) is climatology; Blue (‘W’) is climatology + Ekman
Test of the Ekman current approach Using satellite tracked drifters, drogued at 10m depth Three examples where drift track changed direction with a major wind event. Red (‘D’) is drifter; Green (‘C’) is climatology; Blue (‘W’) is climatology + Ekman Captures the cross-isobath movement
Early Egg distributions: 1. Interpolate each cruise to fine grid 2. Interpolate (in time) to daily values 3. Sum into 10 day bins (e.g., days 40-49, …) Have distributions of early eggs (#/10m2) for 10 day bins for cod and haddock
Drifting the eggs: • 1. For each 20 eggs/10m2 at a grid point, assign one egg particle • (about 500-1000 particles for each 10 day bin; up to 50 at a grid point) • 2. Drift the particles for 17 days (average development time • from the early stage to hatching) • 3. If a particle moves across the 200m isobath, it has left the bank and is lost • 4. After 17 days, determine how many particles have left the bank
Cod Modeled vs Observed Mortality Rate No point for 1996 (Buoy 11 winds missing) R2 = 0.51 Mortality rate (ppd) Haddock Conclusions: Relationship between egg mortality and SE wind stress likely is real. ~8 ppd mortality without drift loss R2 = 0.23 Drift induced mortality rate (ppd)
What was the difference between 1997 & 1998? Wind-induced movement over 17 day drift period 1997 Wind driven transport cross isobath (off-bank) 1998 Wind driven transport along isobath D-75 1998 D-45 D-45 D-75 1997
Drift of early Haddock eggs – 75 day bin 1998 1997 Initial After 17 days
Implications For Recruitment Cod Compare: R vs SSB x Egg survivorship (i.e., R vs index of number of hatched eggs) R2 = 0.59 Recruitment Haddock R2 = 0.57 SSB * Egg survivorship
Conclusions: 1. Variability in egg mortality rates due (in large part) to variability in wind-driven loss from the bank. 2. Variability in egg surviorship a significant contributor to variation in recruitment. 3. Future modeling of the egg/larval period should address time-dependent wind forcing. P.S. Joseph Chase concluded much the same a long time ago 2003 haddock - ‘boomer’ year class; SE Wind was ‘NW’
2003 Haddock Year Class Haddock Mortality rate (ppd) 2003 SE wind stress (pascals)
Cod R vs SSB x Egg Survivorship (1986, 1987, 1995-1999) Recruitment R2 = 0.81 SSB * Egg survivorship
Egg Mortality Rate vs SE Wind Stress (1986, 1987, 1995-1999) Cod Mortality rate (ppd) SE wind stress (pascals)
Cod: ssb*survivorship vs R R2 = 0.59 slope = 2.4
Haddock: ssb*survivorship vs r R2 = 0.57
Drift of early Cod eggs – 45 day bin 1998 1997 Initial After 17 days
Cod – egg hatching vs recruitment R2 = 0.63 For every 1000 eggs, get 5.5 recruits
Haddock Egg hatching vs Recruitment R2 = 0.50 For every 1000 eggs get 14.6 recruits