Download
1 / 30
300 likes | 324 Views
The Greater Metropolitan Houston Traffic Safety Program aims to address the high number of serious crashes in the region through monitoring, analysis, and implementation of road improvements. This program utilizes analytical methodology, policy tools, and partnerships to target high-risk behaviors and populations. With a comprehensive approach that includes education, enforcement, technology, engineering, and emergency response, the program strives to reduce the economic, social, and human costs associated with motor vehicle crashes.

E N D
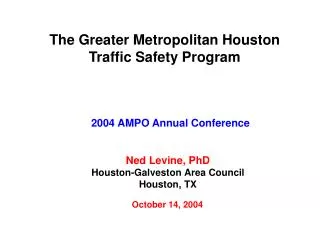
The Greater Metropolitan Houston Traffic Safety Program 2004 AMPO Annual Conference Ned Levine, PhD Houston-Galveston Area Council Houston, TX October 14, 2004
Serious Crash • Fatal crash • Injury crash • Serious property damage crash
Seriousness of Problem • 1999-2001:Houston region • 84,080 serious crashes a year • 627 fatalities a year • 93,971 persons injured a year • The region accounted for: • 26% of all statewide crashes • 27% of all statewide injury crashes • 17% of all statewide fatal crashes • The region has 22% of the statewide population • and, approximately, 21% of the statewide VMT • Likelihood of a fatal or injury crash was: • 36% higher than statewide average • 149% higher than national average
Costs of Motor Vehicle Crashes Human Suffering + Burden on Public Services + Medical Costs + Economic Costs + Congestion Costs = High Insurance Costs Using National Safety Council Methodology: Motor Vehicle Crashes Cost for Region = $4.0 Billion/Year for 1999-2001
Annual Cost to Eight County Region • Direct Economic Costs • $1.9 billion in direct medical, property damage, • legal costs, employer costs, and lost productivity • Comprehensive Costs • $4.0 billion in direct and cumulative lifetime costs • Public Sector Costs • Unknown costs for police, EMS, and public works costs • Congestion Costs • Considerable costs in travel delay • TTI estimates 60% of congestion due to incidents, inc. crashes
Purpose of the Program • Monitor Safety • Obtain data annually • Map the crashes • Identify Problems and Solutions • Identify hazardous locations and area • Conduct the necessary preliminary engineering Implement roadway improvements Identify funding sources Leverage local investment with State and Federal funds Support other safety efforts Enforcement Education Safety partnerships
Combines Analytical Methodology With Policy Tools
High-risk Behaviors: 1999-2001 • RegionU.S.* • Speeding 39%13% • Failing to yield 20%19% • Failing to stop 11%9% • Running a red light 8%5% • DUI 7%7% • (However, involved in 37% of fatal crashes/39% nationally) • Following too close 3%3% • Improper turn 2%2% • * National Safety Council. U.S. average for 1999. Fatal and injury crashes only
High-risk Populations • RegionU.S.* • Teenagers 21%16% • (9% of driving age population/ • 5% nationally) • (17% in fatal crashes /14% nationally) • (19% in incapacitating injury crashes) • Elderly (65+) 8% 8% • (9% of driving age population/ • 13% nationally) • (11% in fatal crashes/13% nationally • 9% in incapacitating injury crashes) • Male drivers 79%60% • (Compared to 58% for females • 1.7 times more likely to be in fatal crash/ • 1.4 nationally) • * National Safety Council. U.S. average for 1999. All crashes.
Safety Policy Directions – the 4 “E’s” • Education • Public awareness – reports/outreach/conferences • Technical – staff/elected official/judges • Enforcement • Patrol officers • Technology • Engineering • Fixing minor hot spots – Maintenance • Fixing major hot spots - Construction • Emergency Response • Assessment • Intervention • Coordination
Safety Analysis • Jurisdictional comparisons • Brazoria County / Fort Bend County / Galveston County • Harris County / Montgomery County / Houston • Alvin / Conroe / Old River-Winfree • Corridor analysis • US 59 W / SH 35 / SH 288 • SH 105 / SH 99 / FM 359 • FM 518 / FM 830 / FM 1960 • FM 2232 / FM 2432 / John F. Kennedy Blvd • Kirby Drive / Nichols Sawmill Road / Spring Steubner • SH 99/Proposed Metro North Line • Small area analysis • Texas Medical Center • Houston City Council District D
Jurisdictional Comparisons Serious Crash Risk (Serious Crashes per 100 Million VMT) Serious CityCrash risk Pearland378 Galveston 337 Baytown 334 Rosenberg 320 Pasadena 290 Conroe 247 Houston231 Texas City 211 Sugar Land 192 Region 204 State of Texas 149
Hot Spot Analysis 344 Major Hot Spots Numerous Minor Hot Spots
Safety Projects & Access Management Houston East End City of Pasadena City of Galveston City of Sugar Land FM 518 FM 1960
Other Safety Activities • Safety Meetings • Developing Plans for Safety Courses • Concept - Regional Safety Council
Safety Web Page http://www.h-gac.com/safety