Download
1 / 34
340 likes | 449 Views
Investigating nonthermal radio-emitting features in the Galactic Center region formed by a massive black hole, featuring large-scale magnetic fields and relativistic electrons. Analysis includes compact radio sources, energetic regions, and quiescent X-ray emissions. Observations from multiple telescopes and studies on flaring X-ray emissions, radio variations, and TeV spectrum measurements. Recent multiwavelength observations provide insights into possible mechanisms for high-energy emissions. Potential models include cosmic ray acceleration and dark matter annihilation near the Galactic Center.

E N D
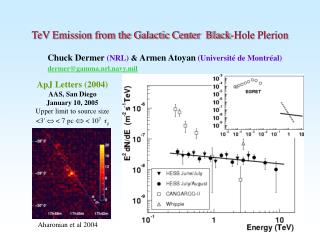
TeV Emission from the Plerion formed bythe Massive Black Hole at the Galactic Center Chuck Dermer(US Naval Research Laboratory) dermer@gamma.nrl.navy.mil &Armen Atoyan (Université de Montréal) ApJ Letters, Dec. 20 (2004) NASA/Goddard Space Flight Center March 1, 2005dermer@gamma.nrl.navy.mil
Galactic Center Region at 90 cm (330 MHz) Nonthermal radio-emitting filaments features Large scale magnetic fields and relativistic electrons SNRs, HII regions Poloidal magnetic field within ~100 pc of nucleus Sgr A*: compact radio sources at nucleus of Milky Way LaRosa et al. (2000)
Inner Sagittarius region (4 3 , or 9.37 pc) Sgr A East (blue): extremely energetic (1052 ergs) region occurring 50,000 yrs ago from chain of SNRs, a GRB, or star swallowed by BH. Diffuse X-ray emission. Sgr A West (red): Gas and dust streamers ionized by stars and spiraling around the Galactic center, possibly feeding the nucleus. Sgr A*: A bright compact radio source at intersection of the arms of the Sgr A West 6 cm VLA radio of Sgr A East and Sgr A West (Yusef-Zadeh, Melia, & Wandle 2000)
Molecular dusty ring (circumnuclear disk: CND) • Three-arm spiral of ionized gas and dust streamers (Sgr A West) • Evolved and young star clusters • Diffuse hot gas • SNR • Massive BH Inner few parsecs IRS 7 Sgr A* HCN CND and1.2 cm Sgr A West images 2 cm VLA radio of Sgr A West (0.8 pc 0.8 pc ) (Yusef-Zadeh & Wardle 1993) (Wright et al. 1993) (4 pc 4 pc )
Massive Black Hole at the Center of the Milky Way Galaxy IR (K-band) observations of stellar radial velocities 1 arcsec = 0.04 pc = 46 lt-days (dGC = 8 kpc) NIR speckle imaging techniques Mass within 0.015 pc 4106 M rS/dGC = 10 marcseconds R. Genzel, et al. (2004) Eddington luminosity:
Massive Black Hole at the Center of the Milky Way Galaxy IR (K-band) observations of stellar radial velocities 1 arcsec = 0.04 pc = 46 lt-days (dGC = 8 kpc) NIR speckle imaging techniques Mass within 0.015 pc 4106 M rS/dGC = 10 marcseconds R. Genzel, et al. (2004) Eddington luminosity:
(3.5 pc 3 pc ) Quiescent X-ray Emission from Sgr A* X-rays exhibit two different states: 1. Weak quiescent X-ray emission from an extended region size of 0.6 arcseconds, or 71016 cm 105 rS Luminosity few 1033 ergs s-1 0.5-7 keV Chandra X-ray image overlaid on 6 cm radio image (Baganoff et al. 2003)
2. X-ray flares with a period of about one per day, rising by factors up to 100 during several tens of minutes. A distinctive point source becomes visible at the location of SgrA*. Flaring X-ray Emission from Sgr A* Baganoff et al. (2001) The short rise-and-decay times of the flares suggest that the radiation must origin from a region within less than tens of rS
INTEGRAL observations of flaring 20-40 keV emission within 0.9 of Sgr A* Flaring Hard X-ray Emission from the Direction of Sgr A* Bélanger et al. (2004) Flare lasts < 40 minutes
Radio Emission from Sgr A* Radio emission of Sgr A* varies slowly on time scales of several days to a few hundred days and generally with an amplitude <10%. Sn n1/3 Falcke et al. 2003 Radio image blurred l2 by ionized medium, but becomes less at high frequencies (images at 5, 8, 15, 32, and 43GHz). Zylka et al. 1995, Zhao et al. 2001
Resolving Sgr A* Theoretical simulations of 1.3 cm images of Sgr A* Bower et al. (2004) Intrinsic size of Sgr A* measured using VLBA 242 rS at 7 mm (43 GHz) Falcke, Melia, & Agol (2000)
HESS: High Energy Stereoscopic System 4 Telescope Array completed Dec 2003 23 16' South Latitude GC: -29 0'
HESS Observations of TeV Emission from Sgr A* Two observing campaigns: June/July 2003 (4.7 hrs on-source) July/August 2003 (11.8 hrs on-source) PSF 0.1 Angular distribution of g rays in 3 field Point Source consistent with Sgr A* 6.1s in June/July 9.2s in July/Aug No evidence for variability between the two pointings Galactic Plane feature Aharonian et al. (2004)
HESS Measurements of TeV Angular Distribution Center of gravity of g rays (triangle), 68% and 95% confidence regions for source position (solid ellipses), and 95% confidence of rms source size (dashed ellipse), superimposed over 8.5'8.5' Chandra X-ray map. Aharonian et al. (2004) Angular distribution of g rays Upper limit to source size = 3' 7 pc
HESS Measurements of TeV Spectrum of Galactic Center Source E2dN/dE spectrum for June/July, July/August campaigns dN/dEE-2.210.2110-8 m-2 s-1TeV-1 (≈5% of the Crab) In agreement with Whipple (Kosack et al. 2004); disagrees with Cangaroo-II (Tsuchiya et al. 2004)
Multiwavelength Observations of Galactic Center Region ~1036 ergs s-1 Aharonian & Neronov (2004) EGRET emission displaced from direction to GCBH
Previously Proposed Models for TeV Emission g rays from p0 production from secondary nuclear production of cosmic rays (possible accelerated by Sgr A West SNR) Annihilation of supersymmetric dark matter particles (Requires neutralinos of mass > 4-10 TeV) Jet-ADAF model (acceleration in the inner jet from shocks; would expect significant variability) Proton curvature radiation TeV jet models (where is the jet?)
TeV Radiation from the Galactic Center Black-Hole Plerion Termination shock F1 . . m m ADAF F2 F1
Accretion Physics in the ADAF/ADIOS Regime Advection-dominated accretion flow (ADAF) model for compact objects accreting at low Eddington accretion rate Radiant luminosity at the level is fraction of accretion power that is advected into black hole or convectively escapes Esin, McClintock, & Narayan (1997)
Second-order Fermi Acceleration in the ADAF No optically thick accretion disk Second-order stochastic Fermi acceleration for radio-sub mm emission for a region of size 20 rS Equating acceleration rate of electrons by Whistler turbulence to synchrotron loss rate: Steady-state electron spectrum: Dermer, Miller & Li 1996; Liu, Petrosian, & Melia 2004
Stochastic acceleration model for radio/sub-mm emission Atoyan & Dermer (2004)
Electrons and protons accelerated by first-order (shock) Fermi acceleration. • Electrons emit X-ray synchrotron radiation to form quiescent X-ray emission • and Compton scatter • ADAF emission • 1013 Hz emission from cold dust ring around Sgr A* The Black Hole Plerion Particle escape by convective outflow in advection-dominated inflow-outflow source (ADIOS) extension (Blandford & Begelman 1999) of ADAF model. Assume a wind power With speed vwindc/2 directed into solid angle W 1 sr Wind terminates at a subrelativistic shock at found by equating thermal gas pressure with energy density of wind Neutron Star Plerion: Crab Nebula
Radio/sub-mm, quiescent X-ray, TeV emission Atoyan & Dermer (2004) Atoyan & Dermer (2004)
Flaring Emissions from Inner Region 200 s 1200 s ff at 200 s ne = 108 cm-3 3600 s Flares from instabilities in accretion flow that form shocks at few rS First-order Fermi shock acceleration injects electrons with g < 106, -2.2 injection index Explains X-ray/NIR flares and short variability timescales from cooling and expansion Self-absorbed flares at < 100 GHz from same electrons in “expanding source” scenario
Multiwavelength Emission from Sgr A* Electron Distribution Very weak > 100 MeV g-ray emission
Galactic Center Black Hole Emission:Sgr A* ADAF + Black-Hole Plerion + Sgr A West, a black-hole remnant Predict GLAST detection of quasi-stationary Compton and bremsstrahlung fluxes from pc-scale plerion. Propagation of GeV electrons power Sgr A West EGRET emission from young pulsar
2 cm VLA radio of Sgr A West Multiwavelength Observations of Sgr A* Sgr A* ~1036 ergs s-1 (Yusef-Zadeh & Wandle 1993)
Chandra Obs. of Sgr A* Sgr A* Multiwavelength Observations of Sgr A* ~1036 ergs s-1 Baganoff et al. 2003
Multiwavelength Observations of Sgr A* ~1036 ergs s-1 Baganoff et al. 2001
Multiwavelength Observations of Sgr A* EGRET Obs of Galactic Center ~1036 ergs s-1 Vela-like Pulsar? EGRET emission displaced from direction to GCBH Dingus and Hooper 2002; Pohl 2005
Summary TeV radiation from Galactic Center Region: Important Discovery from next generation Imaging Air Cherenkov Telescopes Observations imply two emission regions: Inner region near black hole Black hole plerion at the termination shock New insights into black-hole accretion in the extreme ADAF regime for GCBH; advection and convective outflow from central accretion flow X-ray flares are synchrotron emission within ~10 rS of GCBH Quasi-stationary TeV emission (southern hemisphere Crab) TeV g rays made by black-hole plerion, first of a new class of nonthermal emitters
Unidentified EGRET/TeV Sources Plerions from Binary Compact objects accreting << Ledd Isolated accreting black holes Winds and plerions associated with blazars?
Black Hole Archaeology • Stellar velocity dispersion • Reverberation mapping • Bulge/BH relation Measure MBH from g-ray variability Light crossing time-scale: 104 M9 sec Liso from g-ray and multi-wavelength observations Jet opening angle: variability analysis, multiwavelength modeling
The life history of massive and supermassive BHs (within ADAF framework) 0 PG FR2 - FSRQ ULIG log10 FR1 -BL Lac Field Spiral Track Cluster Merger Track GCBH -10 0 5 10 log10 M/M