Geological Systems Sulfur Isotopes Analysis
Explore sulfur isotope ranges in geologic systems, including evaporate and sedimentary rocks. Analyze ion values and water quality in Griffy Lake and natural waters. Study hydrochemical facies and water chemistry in Southern Indiana. Investigate Octopus Spring in Yellowstone National Park.

Geological Systems Sulfur Isotopes Analysis
E N D
Presentation Transcript
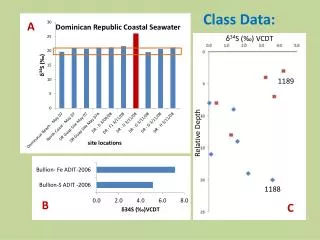
Class Data: A δ34S (‰) VCDT 1189 Relative Depth B 1188 C
Ranges of S Isotopic Values in Geologic Systems evaporate sulfate ocean water sedimentary rocks metamorphic rocks granitic rocks basaltic rocks extraterrestrial materials (meteorites and lunar rocks) δ34S (‰ VCDT) Range of sulfur isotopes in geologic systems. Note the difference between mantle-derived S and Sedimentary sulfides (Hoefs, 1980, fig. 12). -50 -40 -30 -20 -10 0 10 20 30 40 50 60 Where do you predict the Henryville copiapite crust values to fall?
Data Analysis and Presentation
Data from Natural Waters
Ion Values in Griffy Lake and adjoining Fly Ash Retention Ponds Sampling of several different locations in Griffy Lake as well as sampling of retention ponds with water occurred in October and November. Seven samples were obtained from Griffy Lake in October, and eight in November. Six retention pond samples were taken in October, and eight in November. Figure 1. – Average cation concentration as observed over several samplings during October and November from various locations in Griffy Lake and several retention ponds. Figure 2. – Calculated cation concentrations from Griffy Lake and retention pond samplings.
Figure 3. – Estimated Anion Values in mg/L as determined by using cation-anion balance with a 5% allowable error based on observed cation (meq/L) values. The total cation charge was calculated to be 4.31 in the Lake and 8.69 in the retention ponds, with an acceptable error of +/-0.22 and 0.43 respectively.
Background Nantucket Island Fig 1. Location of the study area 7 Dec 2010Yanyan CHEN Department of Geological Sciences, IUB
Hydrochemicalfacies • Ca2+ – Mg2+ – Cl- – SO42- Type • Ca2+ – Mg2+ – HCO3-Type • Na+ – K+– HCO3- Type • Na+ – K+ – Cl- – SO42- Type (I) (II) (IV) (III) Fig 2. Piper trilinear diagram showing hydrochemicalfacies (HCO3- concentrations are calculated from Ca2+ concentrations) 7 Dec 2010YanyanCHEN Department of Geological Sciences, IUB
Water quality assessment Table 1. The wet chemistry data for test wells (mg/L) Drinking water standard is from http://water.epa.gov/action/advisories/drinking/upload/dwstandards2009.pdf a: Maximum contamination level ; b: Secondary drinking water regulations ; c: From Drinking water Advisory Table
Water Well drilled into New Albany Shale Samples at depths 1-10 a and b denote different times
Sulfate drops with depth • Less sulfate in a than b • Much more nitrate in a than b • Something occurred between times a and b Fig 1 – Piper diagram of ion concentrations (%meq/L) in samples from well in New Albany Shale at times a and b Fig 2 – Average ion concentrations (mg/L) at time a and b
Southern Indiana Springs and Seeps • Sampling occurred on 4 springs and seeps in Southern Indiana, analyzed for _ and_ • Bedrock geology was predominated by the Raccoon Creek Group (Pennsylvanian), Buffalo Willow Group and West Baden Group (Mississippian) • Dominate rock types includes shale, sandstone, and limestone with small amounts of clay.
Wedge Quarry Ice Box Spring Mound Spring Middle Spring Figure 1: Diagram shows the general water chemistry of four springs and seeps. Samples taken in a 1 km2 in French Lick, Indiana in April 2009. Wedge Quarry seep, Mound Spring and Middle Spring are classified as Ca2+ and HCO3- dominate. Ice box Spring is Ca2+ and SO42- dominated.
Octopus Spring • Yellowstone National Park: Lower Geyser Basin • Discharge of ~80gal/minute • Alkaline Hot spring • Temp: ~90⁰C pH: ~8.5 • Temp, pH, SpC, and Eh vary spatially throughout the right and left forks • Supports communities of Photosynthetic & non- photosynthetic Bacteria + Algae and Fungi • Blue color in Large Pool is a result of dissolved silica particles (<10microns). Water is actually a colloid Octopus Spring. July 2008. Note the blue color of the water and the orange microbes growing near the siliceous sinter. Synechococcus
Examining The Data A: B: Figure 1: A; Specific conductivity (mS/cm) and temperature (⁰C) as a function of distance (m) along the right fork of Octopus Spring, exhibiting a general trend of decreasing SpC with decreasing temperature. B; Specific conductivity (mS/cm) and temperature (⁰C) as a function of distance (m) along the left fork of Octopus Spring, exhibiting a general trend of decreasing SpC with decreasing temperature. Octopus Spring. Yellowstone National Park. Erika Elswick and G329. July 4, 2003.
Examining The Data Figure 2: Eh (mV) and pH as a function of distance along the right fork of Octopus Spring. Eh values range from +100 to -13 mV. pH values range from 8.5 to 9.0. Octopus Spring. Yellowstone National Park. Sampled by Erika Elswick and G329. July 4, 2003. • Factors Contributing to Variation: • Distance from source and water depth affect Temp. • Rhyolite bedrock contributes dissolved silica • Temp. affects solubility of silica • Influence of the microbial community • Dissolved hydrogen gas • Lack of hydrogen sulfide contributes to high pH • Reduced conditions despite exposure to oxygen
Data from Soils and Sediments
Accumulation of Metals in Western Pearl Mussel Shells • Samples collected at Bear Valley Creek, one site was upstream from dredging, one downstream. • Data suggests that silica, titanium, strontium, and barium accumulate in shells downstream from dredging sites. • Data can be analyzed by looking at average and standard deviations concentrations of species. • Analysis could be performed by powdering shells and digesting them as we did with black shale. These solutions could be analyzed by AAS or gravimetric analysis.
It appears that peak TiO2, SiO2, Ba, and Sr levels correspond to the same samples. This may be due to dredging that grinds metal-rich igneous bedrock and inputs cation species into the water. These minerals may be precipitated with Ca when the bivalves create their shells, and are locked into the shells permanently. The minerals released in dredging occur when mining Fe, Mn, Nb, and Ta ores, which are due to contact metamorphism of granites.
Carmichael Creek Figure 1. This graph shows the weight % of P2O5 determined from soil samples taken along a vegetation transect. The transects were located on north and south facing slopes within Carmichael Creek valley in Montana. The x axis labels tell the position of the transect relative to the creek (1S representing the samples closest to the stream on the south facing slope). The blue represents the O-horizon, the red represents the A-horizon and the green represent the-B horizon. The detection limits were to 0.02 wt%.
Figure 2. This graph shows the weight % of MgO from soils samples taken within Carmichael Creek Valley in Montana. The soils were taken along a vegetation transect on north and south facing slopes, represented with an N or S on the x-axis with the numbers moving from 1 to 4 relative to distance from Carmichael Creek. The blue represents the O-horizon, the red represents the A-horizon, and the green represents the B-horizon. Figure 3. This graphs shows the wt.% of K2O of soil samples taken along a vegetation transect in Montana. The x-axis labels represent distance from Carmichael Creek and location on either on the north or south facing slope, 1 being closest to the creek. The blue represents the O-horizon, the red represents the A-horizon, and the green represents the B-horizon.
Montana Soils Figure 1. Nickel and molybdenum concentrations are plotted against elevation. Data is from soil samples taken in 2003 as a belt transect up a valley wall near the South Boulder River in southwestern Montana. High nickel concentrations at the lower elevations indicate a possible intrusion. As elevation increases, other elements such as molybdenum have a higher relative concentration, indicating lack of influence from an intrusion.
Montana Soils Figure 2. Total organic carbon is plotted against zinc concentration. Data is from soil samples taken in 2003 as a belt transect up a valley wall near the South Boulder River in southwestern Montana. The graph indicates moderate correlation with an R2 value of 0.758.
Soils from abandoned agricultural fields near Bloomington, IN Location and geologic map of Garvey and Griffy samples
Concentrations of trace elements in ppm. Depth increases from darker to lighter colors • GRI-Sanders Group Limestone • GAR-West Baden Group (shale, mudstone, sandstone, some limestone) • Ni, Co, Cr, V, and Zn appear to be mobile in Garvey soil accumulating near the bottom of the profile possibly due to a clay rich B-horizon and a higher water table. • Zr appears to be mobile, but the other elements appear to be accumulating near the top of the profile. The plant cover is much different at the Griffy site which may account for accumulation in the A-horizon due to more biological activity.
Aegina Clays - Greece • Four suggested clay groups: marls, epiclasticflows, alluvial clays andterra rossasoils. • Epiclastic flow clays are characterized with thehighest content of SiO2 (50.91 – 62.66%) and Al2O3 (12.71-19.32%). • The marl clays are characterized with the low silica content and the highest content of both CaO (16.11-51.86%) and total C (3.23-11.96%). Also, they show the highest values of LOI. • The terra rossasoilclays have concentrations of SiO2 and Al2O3 that are close to the concentrations of epiclastic flow clays, BUT they have higher Fe2O3 and K2O content. • Alluvial claysdon’t show a characteristic signature, but can be compared to the previous groups by having SiO2 and Al2O3 contents higher than that of marl clays and lower than that of the epiclastic flow clays. CaO and total carbon are intermediate between the two groups too. • Is sample A82 epiclastic flow or alluvial clay? Comparing the concentrations of Al2O3, CaO, total C, NaO and Ba in this sample, it belongs to the group of epiclastic flow.
Different clay samples from Aegina – Greece. The diagrams show that samples of each group have very close behavior and cluster together. Two marl sample are away from the other marl samples because of their low SiO2 content, they might be limestones. Sample A82 is closer in its chemical behavior to the epiclastic flow clays as figures A and B show.
Lerna, Greece Sediments • Lernawas known throughout Ancient Greece for its pure spring water. • Modern-Day Lerna is just south of the city of Argos, an ancient city-state known for its harbor. • Hercules slayed the Hydra at Lerna. • The underlying geology is a Karst system with mountains to the West. • 10 sites around Lerna were sampled and the sediments (<10,000 years old) were analyzed for major oxides, trace elements, LOI, and total carbon/sulfur.
I theorized that these coastal plain sediments were weathered from: • Low-Si igneous rocks from the western mountain range, based on average Si content • Underlying carbonate system, due to the high CaO levels relative to other oxides and the high TOT/C. • All of the samples appear to be from the same parent materials. Both major oxides and trace elements align closely, with no major outliers. • Very high concentration of Ni, which is commonly mined in Greece. Organic component of coastal plain sediments from Lerna, Greece, by Hannah Timm from Christina Shriner’s collection. wt. % ppm Major oxides in wt. % and trace elements in ppm analyzed from coastal plain sediments from Lerna, Greece, by Hannah Timm from Christina Shriner’s collection. No date.
Data from Sedimentary, Metamorphic and Igneous Rocks
Rio Maton Mid-Cretaceous sediments, Puerto Rico • Mixture of carbonates, volcanoclasticsand mudstones • Geochemistry shows a general increase in TS and decrease in TIC up section (deepening upward cycle) • More of a shallow marine environment in the lower portion with transitional to deep marine as you move upward in section
Cretaceous • This was a greenhouse time dominated by sea-floor spreading and elevated CO2 levels • The lower portion shows higher TIC than the upper portion which indicates more shallow-marine to lagoonal environment (brackish- normal marine) • As you go vertically through the section you will find a general decrease in TIC. This can be interpreted as a deepening upward cycle where accommodation is higher than the shallower, lower section leading to an increase in siliciclastic dilution
Data Set TS (wt%) Wt% TS Wt% TIC Fig 1: This data set shows sample numbers on the x-axis which is assuming that 1 is the top of the section and 25 is the bottom of the section. It is clear that there are at least 3 deepening upwards cycles where the bottom half of the section is dominated by limestone (sample 13-25) and from sample 13 on begin the cycle of deep marine and more of a siliciclastic input. Fig 2: Assuming that 1 is the top of the section, the data shows the bottom portion to have lower TS values than the upper portion. This is due to an overall deepening trend with more accommodation for silicilcastics. Where as the bottom part of the section was more of shallow marine/lagoonal environment.
Devonian-Mississippian Black Shale, Northern • Kentucky • These elements seemed the most influential in • determining the lithologic boundaries. • As you can see, these elements show fairly constant trends throughout the core. • Marine vs. Non-Marine input • - these elements are often associated with • marine environments • - seesaw affect due to river setting • There was almost no Uranium but some thorium • - Uranium binds with Oxygen leaving Thorium • behind • - Thorium has been put to use as a Nuclear Energy Source • Explanation for Zinc?
Figure 1. The above figure analyzes the different concentrations (ppm) of Zr, Pb, Zn, and Co for the Devonian-Mississippian Black Shale in Northern Kentucky collected in 2000, plotted against core depth (m). The different colored lines are denoted on the figure’s legend above.
Devonian-Mississippian Black Shale, Northern Kentucky • The graph on the previous slide shows that the elements are not very mobile and resist weathering • Through research I found that this area is marked as a Pb-Zn deposit region according to the USGS • This data suggests alluvial deposits which are typical in river regions due to river currents • Igneous?
New Albany Shale Organic-rich, black shale deposited in the Illinois Basin Late Devonian to Mississippian in age Six major members: Ellsworth Clegg Creek Camp Run Morgan Trail Salmier Blocher Major source of hydrocarbons Figure 1. Geographic location of the New Albany Shale and Illinois Basin
Three big questions… • These black shales are organic rich, which elements correlate well with organic matter? • Are there any geochemical reasons for the lithologic determinations for the Shale member designations? • How would you geochemically determine if these were marine or brackish sediments?
Which elements are related to organics? Figure 2. Zn, Ni, and Cu plotted against total organic carbon. The positive, roughly linear trend illustrates the dependence these metals have on organic compounds.
Geochemical reasons for member separations? • Selmier Member • Average TOC 2.06% • Higher TiO2 (avg 0.91%) • Higher Zr, Nb? • Blocher member • Average TOC 7.21% • Lower TiO2 (avg 0.64 %) • Lower Zr, Nb? Figure 3. Relationship of Zr/Y and Nb/Y for Salmier and Blocher Members of the New Albany Shale. The Salmier member is much more clustered in both cases, with the Blocher member being slightly lower in Zr and Nb, as well as less clustered.
Geochemical determination of brackish or marine sediments • Brackish water is generally more oxic—these sediments are euxinic • Re and Mo concentrations after Crusius et al 1996 • Less diagenetic pyrite in sediments from brackish waters • High organic carbon to pyrite sulfur ratio (Berner et al. 1984)
Niobrara Chalk and Shale from Nebraska The shale and chalk in the Niobrara were deposited in the Late Cretaceous.1 Shale (Oil/Black) : The Niobrara Shale is thick, rich in organics and thermallymature.2 Chalk: Extensive chalk deposition during the Late Cretaceous. High porosity and low permeability. Gas production (organic chalk beds). 1 Data: The core samples were collected from Nebraska. This was collected on 1999 and the data that was provided was done by X-ray Fluorescence. Table 1: % Oxides: Fe, Mn, Ti, Si, Al, Ca, K, P, Mg, Na with LOI and total oxides. Table 2: Trace elements: Mo, Nb, Zr, Y, Sr, U, Rb, Th, Pb, Zn, Cu, Ni, Co, Cr, V, Ti, Ba. Detection limits of each element. 17 samples ( 8 High Ca (Chalk) and 9 Low Ca (Shale) ). South Dakota Idaho Wyoming Nebraska Utah Colorado Kansas Fig 1: Map showing the Niobrara Shale (red outline). Source: Unconventional Gas Center web site. www.ugcenter.com/Shales/US/Niobrara/ 1: Watney 2010 2: Unconventional Gas center. 2010
Fig2: The Loss on ignition percentage of all oxides in the high Ca samples of the Niobrara chalk and shale core from Nebraska on the year 1999 and done by XRF were plotted with each sample . Fig4: Quantities of trace elements Zr, Sr, Rb, Cu, and Cr were plotted for the high Ca samples. The samples are from cores that were taken from Nebraska (Niobrara chalk and shale, 1999). These elements were chosen for noticeable differences from low Ca samples. The trace elements were extracted by XRF. Fig3: The Loss on ignition percentage of all oxides in the low Ca samples of the Niobrara chalk and shale core from Nebraska on the year 1999 and done by XRF were plotted with each sample . Fig5: Quantities of trace elements Zr, Sr, Rb, Cu, and Cr were plotted for the low Ca samples. The samples are from cores that were taken from Nebraska (Niobrara chalk and shale, 1999). These elements were chosen for noticeable differences from high Ca samples. The trace elements were extracted by XRF.
Eocene Siltstones of the Eastern Mediterranean • House tiles from ancient Mediterranean long-houses. • These are whole slabs of stone (imagine slate roof-tiles from houses in the Midwest) not baked clay tiles. • Question: What is the origin of these house tiles? • Have samples from various rock outcroppings house builders could have used: • K1, SQ, PH, PF, TF, PFH, CS1, CS2, GS & XRS • Have samples of tiles from two different houses: • AS#74 • HTSC-2 to HTSC-20 • Tile and Bedrock were analyzed for minerals (SiO2, Al2O3, Fe203, etc.) and rare elements (Ba, Co, Nb, Rb, etc.) as well as organic matter and sulfur. • I used plots of mineral and rare elements to determine : • Are all HTSC tiles are related? (Q1) • Are AS and HTSC tiles are related? (Q2) • What bedrock types may be related to each type of tile? (Q3)
Figure 1. Bivariat plots of concentrations (weight percent) of major oxides of (a) MgO and CaO (b) Na2O and K2O and trace elements (c) Ba and S in samples of Eocene siltstones (blue diamonds) and two types of stone house tiles HTSC (green triangles) and AS (red square) from the eastern Mediterranean. Red circles indicate siltstone samples similar to AS tile samples and green circles indicate siltstone samples similar to HTSC samples. Labels on siltstone indicate siltstone collection site. Subsamples of each stone and tile were analyzed via INAA for trace elements and major oxides. Erika Elswick et al. 2010.
Eocene Siltstones of the Eastern Mediterranean • Q1: Are all HTSC tiles are related? (Q1) • Yes, HTSC samples are related to one another. They probably came from the same source material. (Fig. 1) • Q2: Are AS and HTSC tiles are related? (Q2) • No, the AS#74 sample is not related to the HTSC sample. It may have been quarried from a different location. (Fig. 1) • Q3: What bedrock types may be related to each type of tile? (Q3) • AS samples seem chemically related to PH and CS samples while HTSC samples appear to be related to PF and PFH samples. Some samples like XRS, K1 and GS don’t appear to be related to any of the tiles. (Fig. 1)
Metamorphic Rocks from the Connecticut River Valley http://pubs.usgs.gov/of/2003/of03-225/of03-225.pdf
Ternary Diagrams B C A D Figures A-D: XRF data of Connecticut River Valley plotted on Ternary diagrams. Plot A: ACF, B: AFM, C: AKF, and D: CSiFM. Data was normalized in order to plot on ternary diagrams. Plot A shows potential for two metamorphic suites harder to distinguish more than one suite with other plots. Q1:Are there any trends that indicate there are one or more groups of samples? Q2:What set of elements is the most diagnostic in making your determination? A1: Definitely one, maybe two at the most. A2: Aluminum and Iron most helpful
Geochemistry of Extrusive Igneous Rocks • Mystery basalts collected in 1999: Trace elements by XRF • Important elements analyzed: major oxides (Si, Ti, Al, Fe, Mn, Mg, Ca, Na, K, P); trace elements - LILE (Li, Be, Rb,Cs, Sr,Ba); HFSE (Zr, Nb, Ta, Hf, U, Th) • Common minerals: silicates – Ti in Rutile, Fe in Illmenite, Mn in Olivine, other majors and LILE in Plag, Zrin Zircons, Cr in Spinels; metals in disseminated sulfides (Po, Pn, Ccp, Py, Sph, Gal) or oxides (Mag, Hem) • Discrimination plots with trace elements: • immobile vs. mobile (enriched by concentration), i.e. Zr vs. Ti • Spidergrams with mantle normalized metals
Geochemistry of Extrusive Igneous Rocks Figure 1: Tectonic discrimination plots for the Bikou Group basalts and Mystery basalts. Ti versus V plot of Shervais (1982). The fields of arc tholeiite, calc-alkaline basalts, mid-ocean-ridge basalt (MORB), continental flood basalts, and ocean-island and alkali basalts were drawn by Rollinson (1993) according to Shervais (1982). From:Wang, X. et al. Geological Society of America Bulletin 2008;120:1478-1492