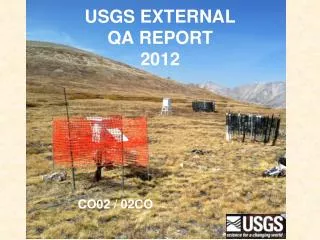
USGS EXTERNAL QA REPORT 2012
USGS EXTERNAL QA REPORT 2012. CO02 / 02CO. MDN Interlab, 2 samples / month. HAL / FGS, Inc., USA North Shore Analytical, Inc., USA USGS, Wisc. Hg Lab, USA Flett Research, Ltd. – Manitoba, Canada Lab Env. Testing (EC) – Quebec, Canada VITO – Belgium IVL – Sweden

USGS EXTERNAL QA REPORT 2012
E N D
Presentation Transcript
USGS EXTERNAL QA REPORT2012 CO02 / 02CO
MDN Interlab, 2 samples / month HAL / FGS, Inc., USA North Shore Analytical, Inc., USA USGS, Wisc. Hg Lab, USA Flett Research, Ltd. – Manitoba, Canada Lab Env. Testing (EC) – Quebec, Canada VITO – Belgium IVL – Sweden Dept. Atmos. Sci. National Central Univ. – Taiwan Jozef Stefan Int. Post-grad School – Slovenia Chinese Academy of Sciences – China Umweltbundesamt / Fed. Env. Agency - Germany GMOS
NO Changes to MDN Interlab Program in 2012 • Did NOT add 3 more GMOS labs. • Italy lab could not figure out how to pay for shipping. • France lab did not show interest • South African lab did not respond • Samples shipped to China keep breaking or leaking from freezing!
2012 3.0 CONTROL = +3 f-psig 1.5 WARNING = +2f-psig 0.0 Hg CONCENTRATION DIFFERENCE, ng/L -1.5 -3.0 JAN JUN DEC
2012 MDN BLANKS 5 4 3 2 1 0 LABORATORIES
MDN Summary • Three-year moving mercury maximum contamination mass in MDN samples is consistently 0.2—0.3 nanograms per sample. • HAL’s high performance is consistent with previous years, with slight negative bias (~1 ng/L) compared to median concentrations reported from 11 laboratories. • In June and July, a positive bias was observed in HAL results for the first time in many years. No effect on trends.
CAL 2012 CONTROL CHARTS pH 0.3 NH4+ 0 CONCENTRATION DIFFERENCE, mg / L -0.3
CAL 2012 CONTROL CHARTS Na+ Ca+2 Mg+2 K+
CAL 2012 CONTROL CHARTS NO3- SO4-2 Cl- Br-
2012 BLANKS 4 samples / Lab / Year
New PCQA Web Site YEAR TYPE OUTPUT .pdf ANALYTE LAB
NEW NTN Interlaboratory Participant! • U.S. Forest Service, • Northern Research Station, • Durham, New Hampshire • Contact: Jeff Merriam
2012 Field Audit 2010-12 Network Maximum Contamination Levels & Ptiles
FIELD AUDIT H-ION CONTAMINATION
FIELD AUDIT H-ION LOSS
2012 Co-located Sampler Program Conclusions • N-CON typically caught more precipitation than ACM • Volume differences not related to concentration • differences • 3. N-CON concentations tend to be higher, but not always, • especially for K, Mg, H-ion • 4. N-CON > concentrations seem to be related to opening • earlier than ACM & catching early onset washout • …but not always
NTN Summary • CAL’s high performance is consistent with previous years. (Possibly more variability in Na+, SO42-, and pH than previously observed.) • Three-year moving Network Maximum Contamination Levels in NTN samples is same or lower than recent past years. • Maximum NO3- and NH4+ losses are lower than recent past years, but H+ loss is increasing.
Study 1. Sample Evaporation in NTN Collector Study 2. MDN Sample Loss Study Study 3. Mercury Adsorption in MDN Sample Trains Study 4. Sensitivity of NTN and MDN Collector Sensors Study 5. Catch Efficiency of NTN Collector with Wind Shield