Download
1 / 9
90 likes | 108 Views
Explore how Australia can boost productivity in the maritime industry by reducing port costs and enhancing infrastructure. Learn about port congestion, container shipping challenges, and future strategies for a more efficient industry.

E N D
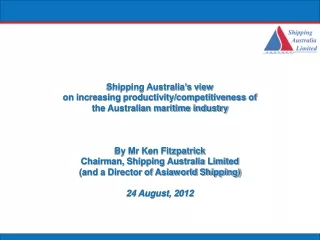
Shipping Australia’s view on increasing productivity/competitiveness of the Australian maritime industry By Mr Ken Fitzpatrick Chairman, Shipping Australia Limited (and a Director of Asiaworld Shipping) 24 August, 2012
Issues to be addressed • It is clear to SAL that Australia is losing ground in terms of productivity/competitiveness in almost all areas of shipping. • The impact of increasing port costs are being exacerbated by congestion and inadequate infrastructure. • Bold steps are needed to reverse the trend. • There are positive signs as far as container stevedoring is concerned; • Third operator • Greater terminal investment/automation www.shippingaustralia.com.au
Increasing port costs SAL monitors the annual price increases for a selection of ports. In 2012 this amounted to 88 individual port charges from 18 ports. Of these 88 port charges, 82 were increases above the forecast rate of inflation for 2012 (2.7%). The average for this data set being an increase of 13%. This average is influenced by the spikes in the graph - from PMoC’s Port Licence Fee and also one-off spikes such as the wharfage charge increase of 53% at Port Hedland.
Port congestion – break bulk Compiled from data retrieved from http://www.phpa.com.au/shipping/qryDepartedrpt.asp www.shippingaustralia.com.au
Container Shipping Congestion • Container congestion in 2010 and 2011 was particularly severe especially in Sydney. • Average port call 5-6 days. • Normal 1.5 to 2 days. • Caused by industrial disputes in the negotiation of a new EBA but; • Also serious operational/lack of productivity problems. • Despite new technology container handling rates per crane hour basically flat-lined over last 10 years: but light at the end of the tunnel. www.shippingaustralia.com.au
Sea/Land Interface: The Pinchpoint • Need to upgrade connections to/from ports. • Development of inland ports to increase freight on rail / ease congestion. • SAL study emphasis need to tackle commercial / contractual issues to promote optimal utilization. • National Port Development Strategy is a start. • Priorities for infrastructure development / harmonization of port planning amongst States/Territories. • Looking forward to National Freight Development Strategy and • State strategies, including NSW. www.shippingaustralia.com.au
The Future • Break bulk infrastructure lacking in Australian ports. • Lack of skilled labour remains a problem. • Looking forward to the priority list to be published by Infrastructure Australia. • State Infrastructure priorities then need to be identified. www.shippingaustralia.com.au
Summary of main points from the presentations we have received today www.shippingaustralia.com.au