Download
1 / 49
550 likes | 941 Views
Traditional Approach to Requirements Data Flow Diagram (DFD). Slides from Prof. Peter Khaiter. Lecture Outline. Traditional Approach vs. OOA Data Flow Diagrams (DFDs) DFD and Levels of Abstraction Context Diagrams DFD Fragments Evaluating DFD Quality Documentation of DFD Components.

E N D
Traditional Approach to Requirements Data Flow Diagram (DFD) Slides from Prof. Peter Khaiter
Lecture Outline • Traditional Approach vs. OOA • Data Flow Diagrams (DFDs) • DFD and Levels of Abstraction • Context Diagrams • DFD Fragments • Evaluating DFD Quality • Documentation of DFD Components
Traditional Approach vs. OOA Two approaches differ in the way the system is modeled and implemented: •Traditional approach: – views a system as a collection of processes(like computer programs, a set of instructions that execute in sequence) – when the process executes it interacts with data (reads data values and then writesdata values back to the data file – emphasizes processes, data, inputs/outputs •Object Oriented approach (OOA): – views a system as a collection of interacting objects which are capable of their own behavior (called methods) which allow the objects to interact with each other and with people using the system – there are NO conventional processes and data files, just interacting objects
Data Flow Diagrams (DFDs) • Graphical system model that shows all main requirements for an IS in one diagram • Inputs/outputs • Processes • Data storage • Easy to read and understand with minimal training (only 5 symbols used) • DFD integrates processing triggered by events (event table) with the data entities modeled by ERD
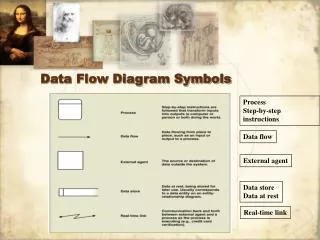
DFD Symbols • The square is an external agent (a person or organization, outside the boundary of a system that provides data inputs or accepts data outputs) • The rectangle with rounded corners is a process (named “Look up item available” and can be referred to by its number, 1) • A process defines rules (algorithms or procedures) for transforming inputs into outputs • The lines with arrows are data flows (represents movement of data). • The flat three-sided rectangle is a data store (a file or part of a database that stores information about data entity)
DFD Fragment Showing Use Case Look Up Item Availability from the RMO
DFD and Levels of Abstraction • DFD is a modeling technique that breaks the system into a hierarchical set of increasingly more detailed models • DFD may reflect the processing at either a higher level (more general view of the system) or at lower level (a more detailed view of one process) • These different views of the system (higher level versus low level) creates the levels of abstraction • DFDs are decomposed into additional diagrams to provide multiple levels of detail • Higher-level diagrams provide general views of system • Lower-level diagrams provide detailed views of system
Context Diagrams • DFD that summarizes all processing activity for the system or subsystem • Highest level (most abstract) view of system • Shows system boundaries • System scope is represented by a single process, external agents, and all data flows into and out of the system
Notes on Context Diagrams •Useful for showing system boundaries (represents the system scope within the single process plus external agents) •External agents that supply or receive data from the system are outside the system scope •Data stores are not usually shown in the context diagram since they are considered to be within the system scope • It is the highest level of DFD • Context diagram does not show any details of what takes place within the system
DFD Fragments • Created for each use case in the event table • Represent system response to one event within a single process symbol • Self-contained models • Focus attention on single part of system • Show only data stores required in the use case
Event-Partitioned System Model • DFD to model system requirements using single process for each use case/activity in system or subsystem • Combines all DFD fragments together to show decomposition of the context-level diagram • Shows the entire system on a single DFD (in greater detail than on the context diagram) • Sometimes called “diagram 0” • Used primarily as a presentation tool • Decomposed into more detailed DFD fragments
Combining DFD Fragments to Create Event- Partitioned System Model
The event-partitioned model of the Order-Entry subsystem (diagram 0)
Decomposing DFD Fragments • Most DFD fragments can be further described using structured English • Sometimes DFD fragments need to be diagrammed in more detail • Decomposed into subprocesses in a detailed DFD • DFD numbering scheme • Hierarchical decomposition • DFD Fragment 2 is decomposed into Diagram 2 • Diagram 2 has processes 2.1, 2.2, 2.3, 2.4 –four steps to complete the activity
Physical and Logical DFDs • Logical model • Assumes implementation in perfect technology • Does not tell how system is implemented • Physical model • Describes assumptions about implementation technology • Developed in last stages of analysis or in early design
Evaluating DFD Quality • Readable • Internally consistent and balanced • Accurately represents system requirements • Reduces information overload – rule of 7 +/- 2 • Single DFD should not have more than 7 +/-2 processes • No more than 7 +/- 2 data flows should enter or leave a process or data store in a single DFD • Minimizes required number of interfaces
Data Flow Consistency Problems • Differences in data flow content between a process and its decomposition • Data outflows without corresponding inflows • Data inflows without corresponding outflows • Results in unbalanced DFDs
Black Hole and Miracle • black hole, i.e. a process with data input that is never used to produce data output. • Miracle - a process with a data output that is created out of nothing ( “miraculously appears”)
Documentation of DFD Components • DFDs show three types of internal system component: processes, data flows and data stores • The details of each component need to be described • Lowest-level processes need to be described in detail • Data flow contents need to be described • Data stores need to be described in terms of data elements • Each data element needs to be described
Process Descriptions • Each process on a DFD must be formally defined • These description methods include: - Structured English - Decision tables - Decision trees • These models describe the process as an algorithm.
Structured English • Method of writing process specifications • Combines structured programming techniques with narrative English • Well-suited for lengthy sequential processes or simple control logic (single loop or if-then-else) • Ill-suited for complex decision logic or few (or no) sequential processing steps
A structured English process description for calculating shipping charges
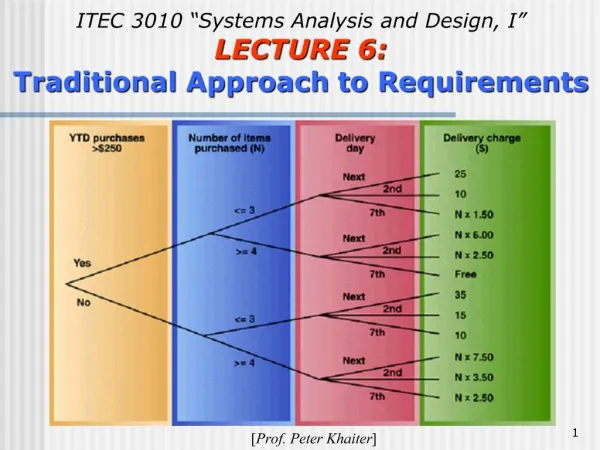
Decision Tables and Decision Trees • Can summarize complex decision logic better than structured English • Incorporate logic into the table or tree structure to make descriptions more readable
Components of a Traditional Analysis Model • Four components of a traditional analysis model are – Data flow diagrams – Entity-relationship diagram – Process definitions – Data definitions • They form an interlocking set of specifications for system requirements • DFD shows highest-level view of the system • Other components describe some aspect of DFD • These models were created in the 1970’s and 1980’s as a part of the structured analysis methodology