Download
1 / 9
90 likes | 177 Views
Explore clinical and IHC cohorts to evaluate the response of GGI, CIN70, Oncotype DX, RB, and Mammaprint signatures in ER+ and ER- breast cancer patients at a statistically significant level.

E N D
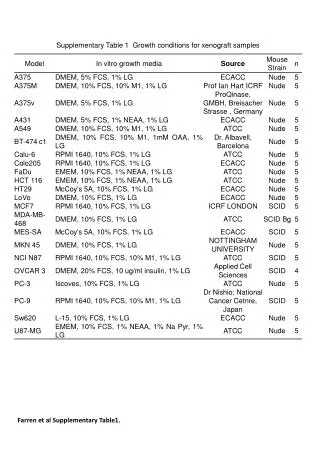
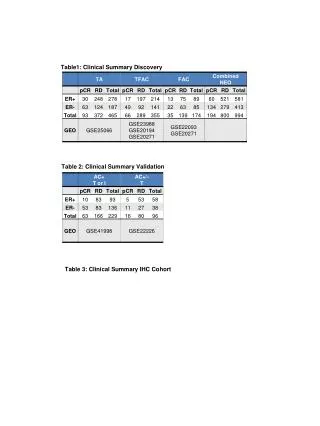
Table1: Clinical Summary Discovery Table 2: Clinical Summary Validation Table 3: Clinical Summary IHC Cohort
Table 4: Patient Characteristics Discovery and Validation Cohorts
S1 GGI Signature - TA Response KS P = 2.58E-09 CIN70 Signature - TA Response KS P = 1.04E-09 S2 GGI Signature - TFAC Response KS P = 0.00769 CIN70 Signature - TFAC Response KS P = 5.57E-05 Oncotype DX Proliferation Genes - TFAC Response KS P = 0.06619 RB Signature - TFAC Response KS P = 0.00108 Mammaprint Signature - TFAC Response KS P = 0.0015
GGI Signature – ER+ S3 Response KS P = 9.78E-05 GGI Signature – ER- Response KS P = 0.001787 CIN70 Signature – ER+ Response KS P = 0.00018 CIN70 Signature – ER- Response KS P = 0.00016 Oncotype DX Proliferation Genes – ER+ Response KS P = 0.00073 Oncotype DX Proliferation Genes – ER- KS P = 0.04734 Response RB Signature – ER+ KS P = 0.0011 Response RB Signature – ER- Response KS P = 0.00045 Mammaprint Signature – ER+ KS P = 0.01288 Response Mammaprint Signature – ER- KS P = 00131 Response
S4 DEK BCAM S5 DEK-IHC BCAM-IHC