Download
1 / 13
130 likes | 212 Views
This project evaluates climate change impacts on extreme streamflows using USGS Streamstats and VIC Model, enabling better management practices for fish habitat and infrastructure protection in Olympic National Forest. The study compares hydrologic models, highlighting the importance of adapting to future warming trends for flood control. Visit the USGS Streamstats tool online for more information.

E N D
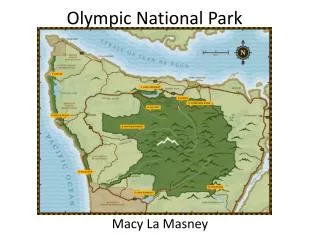
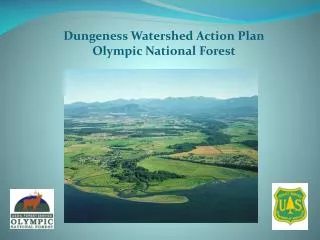
Improving Estimates of Hydrologic Extremes: Applications to the Olympic National Forest Ingrid Tohver PNW Climate Science Conference September 14, 2011 Seattle, WA
Partnerships with Stakeholders Climate Impacts Group & Civil and Environmental Engineering, University of Washington: Alan Hamlet Se-Yeun Lee Ingrid Tohver Robert Norheim Olympic National Forest and Park: Kathleen O’Halloran Luis Santoyo Bill Shelmerdine Robert Metzger Robin Stoddard
Project Premise • Assess potential impacts of climate change on federal lands and incorporate projections into management practices • Update estimates of extreme streamflows • Support protection of fish and wildlife habitat • Support road maintenance and flood control infrastructure Photos courtesy of Olympic National Park
USGS Streamstats Tool • Web-based GIS tool used to estimate streamflow statistics: • Inputs = basin size, annual precipitation and elevation • DEM & PRISM datasets • Regression equation developed by USGS calculates statistics • Climatic caveats: • Unchanging mean annual precipitation • Seasonality is lost in calculation http://water.usgs.gov/osw/streamstats/
Climate Change Scenarios for the PNW Temperatures warm across all projections Seasonal signal of precipitation shifts is lost in the annual projections Mean annual precipitation projections do not show a clear trend Figures’ source: Mote and Salathé 2010
Contrasting Hydrologic Models USGS Regression-based model Regressions applied based on region Historical and future P from climate models • Physically-based VIC Model • Explicitly integrates climate conditions • Applies future T & P projections to estimate daily runoff at each grid cell • Daily runoff used to estimate shifts in extreme streamflow • frequency • Spatial resolution: • Fine - 1/16th ° • Aggregate - 12 digit HUCs
Comparing Results USGS VIC Shows increases in annual precipitation only No response to warmer temperatures or the changing seasonality of precipitation Captures the temporal and spatial variability in the climate models Responds to future warming and increases in winter precipitation with a rise in flood severity
Shift in Flood Severity Comparing the Future to Historical 100-Year Flood – 2040s Map: Rob Norheim 1/16th degree 12-digit HUCs
Shift in Low Flow Severity Comparing the Future to Historical 7Q10 – 2040s Map: Rob Norheim 1/16th degree 12-digit HUCs
Future Applications • Implement extreme streamflow analysis over PNW domain • Assess changes in risk to fish habitat and infrastructure in other National Forests/Parks: • North Cascades • Mt Baker/Snoqualmie • Mt Rainier