Download
1 / 20
210 likes | 463 Views
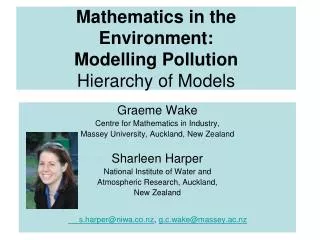
Mathematics in the Environment: Modelling Pollution Hierarchy of Models. Graeme Wake Centre for Mathematics in Industry, Massey University, Auckland, New Zealand Sharleen Harper National Institute of Water and Atmospheric Research, Auckland, New Zealand

E N D
Mathematics in the Environment:Modelling PollutionHierarchy of Models Graeme Wake Centre for Mathematics in Industry, Massey University, Auckland, New Zealand Sharleen Harper National Institute of Water and Atmospheric Research, Auckland, New Zealand s.harper@niwa.co.nz, g.c.wake@massey.ac.nz
Rules of the day • Who are we??? • What do we want to do? • You do the work. • Start simple • Be prepared to be wrong • Discuss, Discuss……. • Speak up, speak up,….. • Concentrate on learning the process • Learn by doing
Modelling Paradigms Modelling Philosophy The 10 commandments • Simple models do better! • Think before you compute • A graph is worth 1000 equations • The best computer you’ve got is between your ears! • Charge a low fee at first, then double it next time • Being wrong is a step towards getting it right • Build a (hypothetical) model before collecting data • Do experiments where there is “gross parametric sensitivity” • Learn the biology etc. • Spend time on “decision support”
MISG2005: Problem 4: Moderators: Heather North, Rod Weber, Joanne Mann • Factors Associated With Trends in Bare Ground in the Central South Island High Country • Jeromy Cuff • Environment Canterbury • Timaru
Some South Island Hill and High Country Issues • Bare ground creates surface erosion risk • Extensive areas of LUC classes VII and VIII land destocked in the 1960s - 1980s • Objective was to improve ground cover • Hieracium species have invaded tussock grasslands • Out competes resident vegetation but is not persistent • Doesn’t provide 100% cover
MISG 2005 Challenge • Create a mathematical model that identifies and describes the main effects and interactions of the factors influencing short and long term ground cover trends in the high country. • Such a model would be invaluable for identifying land management options and could be applied to help ensure soil conservation in the Canterbury high country tussock grassland ecosystems by identifying and quantifying the important factors • to prevent further deterioration in hign country condition and • improve the condition of presently degraded lands
1.First Pond model • One- off dump.P(t) pollution, O(t) oxygen dP = - kp P, P(t = 0) = Po, dt dO = - koP, O(t = 0) = 100% dt
Tasks……….. • Solve • Units, what are they???? • Develop decision-support procedure: Po < Pcrit ↔ O(t → ∞ ) > 30% • What’s Pcrit ?? Plot it as a function of various parameters. Which? • Produce a client report – Group 1
2. Second Pond Model • Oxygen restoration One- off dump. P(t) pollution, O(t) oxygen dP = - kp P, P(t = 0) = Po, dt dO = - koP + k(100 – O) , O(t = 0) = 100% dt
Tasks to discuss • What’s the oxygen term? • Solve • Produce a modified decision-support scheme Po < Pcrit ↔ O(t → ∞ ) < 30% • What’s Pcrit ?? • Suggest strategies for improvement within the suggested goals: Po as big as possible O(t large) > 30% • Produce a client report : Group 2
3. Third pond model Constant dump rate. P(t) pollution, O(t) oxygen dP = - kp P + po, P(t = 0) = 0, Easier!! dt addition at constant rate dO = - koP + oxygen , O(t = 0) = 100% dt
Tasks • Solve • Produce a modified decision-support scheme po < pcrit ↔ O(t → ∞ ) > 30% • What’s pcrit ?? • Suggest strategies for improvement within the suggested goals: po as big as possible O(t large) > 30% Produce a client report – Group 3.
n. Ultimate model Factors to incorporate in model • Position : What’s the equation?? • Tidal flow • Dumping strategy HOW??????? Discuss. How?? Discuss??
Ultimate Model Factors to incorporate….. • Spatial structure p(x,t) etc. Units??? • River and tidal flow? • Dispersion….hard!!!!! • What’s the model? • Can we do what we did with tasks 1,2,3? • Let’s do it. Graeme + Sharleen to elaborate.