Download
1 / 11
110 likes | 281 Views
Welcome Chequamegon National Forest, Wisconsin FARSITE and HARVEST model Interactive By Jacob LaCroix, LEES Lab, UT. Introduction Fire Spread Red Pine Site Photos Simulation Data Table/Graph Hardwood Site Photos Simulation Data Table/Graph Jack Pine Site Photos Simulation

E N D
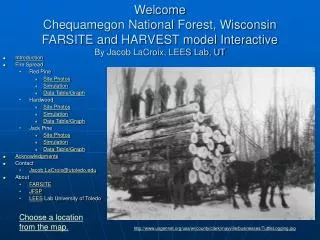
WelcomeChequamegon National Forest, Wisconsin FARSITE and HARVEST model InteractiveBy Jacob LaCroix, LEES Lab, UT • Introduction • Fire Spread • Red Pine • Site Photos • Simulation • Data Table/Graph • Hardwood • Site Photos • Simulation • Data Table/Graph • Jack Pine • Site Photos • Simulation • Data Table/Graph • Acknowledgments • Contact • Jacob.LaCroix@utoledo.edu • About • FARSITE • JFSP • LEES Lab University of Toledo Choose a location from the map. http://www.usgennet.org/usa/wi/county/clark/mayville/businesses/TuttleLogging.jpg
Introduction My goal with this project was to place fires on the Chequamegon National Forest, WI in the model FARSITE in different habitats and to vary the timber harvesting amounts and patterns with the model HARVEST to see if changing the landscape structure would affect how far the fires would spread in 15 days. Please follow the links or the outline. http://www.endangeredforests.org/images/big_forest_pics/cn.jpg Choose a location from the map. Back to outline End
Choose a Location. Red Pine Stands Northern Hardwoods Jack Pine Barrens No more activities, end. Lake Lenawee N Fire Tower Twin Lakes Campground Horseshoe Lake Horse Camp Back to outline Legend Red = Litter with no under story, Red Pines Green = Litter with under story, Northern Hardwoods Yellow = Brush < 2 ft high, Pine Barrens Brown = Light Logging Slash, Clear cuts Moquah Natural Area Pipeline Bladder Lake Pipeline 1 2 3 Miles
Red Pine Stands Characterized by FARSITE as fuel with litter but no under story. http://sevilleta.unm.edu/research/crosssite/carbon/images.htmhttp://www.johndee.com/pix/2002/mar15-3.jpg Back to outline
Red Pine Stands: Choose the harvest pattern and amount and the level of rain desired. Back to locations Back to outline End
Northern Hardwoods Forest Type Characterized by FARSITE as fuel with litter and under story. Northern Hardwoods may include species like Sugar Maple, Red Maple, Red Oak, White Oak, Ironwood, Hazelnut and can, in this exercise, include softer Birches and Aspens. Back to outline http://www.fs.fed.us/r9/cnnf/reports/report1999/ http://sevilleta.unm.edu/research/crosssite/carbon/images.htm
Northern Hardwoods: Choose the harvest pattern and amount and the level of rain desired. Back to locations Back to outline End
Jack Pine Barrens Habitat Characterized by FARSITE as surface fuel that is brushy, up to 2 feet high. Jack Pine can grow on sand left behind by the glaciers. The sand barrens in Michigan have Jack Pines that are the only habitat of the Kirtland’s Warbler. Kirtland's Warbler An endangered species that requires Jack Pine habitat. Back to outline http://www.americanforests.org/productsandpubs/magazine/archives/2002winter/feature1_1.php http://botit.botany.wisc.edu/images/veg/Savanna/Jack_pine,_aspen_VK.html http://www.parkpoint.org/reports/vegetation_survey_report/vegsurvey.htm
Jack Pine Barrens: Choose the harvest pattern and amount and the level of rain desired. Back to locations Back to outline End
This chart shows the mean (N=12) area of the fires burned in 15 days using August, 2002 weather as the control level for each of the five harvest scenarios. The control landscape is no harvest. Data table is included. Back to outline End
Acknowledgements • This work is supported by a grant from the Joint Fire Science Program. • Daolan Zheng, Soung-Ryoul Ryu and Jiquan Chen from the Landscape Ecology and Ecosystem Sciences Laboratory (LEES) at the University of Toledo in Toledo, Ohio. • Thanks go to the United States Forest Service and the creator of FARSITE Mark Finney. http://www.historicalcalendars.com/calendars/logging/Large_Jan.jpg Choose a location from the map. Back to outline