Download
1 / 35
350 likes | 480 Views
Internet Use and Depression Among the Elderly Policy Paper No. 38. WWW.PHOENIX-CENTER.ORG October 15, 2009 The University Club Washington DC. Purpose of Research. Add to the evidence on the effects of Internet use on economic and social outcomes Policy Relevance Academic Relevance

E N D
Internet Use and Depression Among the ElderlyPolicy Paper No. 38 WWW.PHOENIX-CENTER.ORG October 15, 2009 The University Club Washington DC
Purpose of Research • Add to the evidence on the effects of Internet use on economic and social outcomes • Policy Relevance • Academic Relevance • Evaluate Internet effects on a micro-level • Macro-level Studies are of Low Credibility • Apply statistical and econometric techniques intended to render “causal” effects www.phoenix-center.org
Policy Relevance: ARRA 2009 • 6001(b) The purposes of the program are to— • (3) provide broadband education, awareness, training, access, equipment, and support to— • (B) organizations and agencies that provide outreach, access, equipment, and support services to facilitate greater use of broadband service by low-income, unemployed, aged, and otherwise vulnerable populations; • 6001(g) The Assistant Secretary may make competitive grants under the program to— • (4) facilitate access to broadband service by low-income, unemployed, aged, and otherwise vulnerable populations in order to provide educational and employment opportunities to members of such populations; www.phoenix-center.org
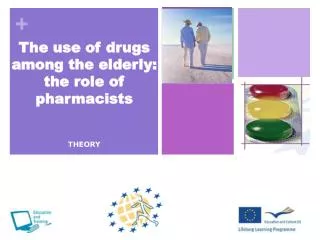
Mental Health and the Internet • Evidence is Mixed • Surprisingly large amount of research on this topic • But, sample sizes are typically very small • Focus typically on younger persons • Theories: • Internet expands social network/interaction, reduces loneliness, thereby reducing depression • Internet use can lead to social exclusion, thereby promoting depression • Internet may aid in finding and receiving treatments, reducing depression www.phoenix-center.org
Social Support for the Elderly Adequate social and emotional support is associated with reduced risk of mental illness, physical illness, and mortality For the elderly, Internet use may be an effective, low-cost way to expand social interactions, reduce loneliness, get health information and treatment, and, consequently, reduce depression www.phoenix-center.org
Cost of Depression • Depression cost society about $100 billion annually • Workplace Costs (62%) • Direct Health Care Costs (31%) • Increased Suicide Mortality (7%) www.phoenix-center.org
Mental Health Statistics(CDC Stats) 20% of people 55 years or older experience some type of mental health concern Men age 85+ have a suicide rate of four times the average Older adults with depression visit the doctor/emergency room more often, use more medications, incur higher outpatient charges, and stay longer in the hospital Frequent Mental Distress may interfere with eating well, maintaining a household, working, or sustaining personal relationships, and can contribute to poor health (smoking, low exercise, bad diet) 80% of cases are treatable www.phoenix-center.org
Depression and Major Risk Factors • 7.7% Adults 50+ in “Current Depression” • 15.7% Adults 50+ have “Lifetime Diagnosis of Depression” • Major Risk Factors • Widowhood • Physical Illness • Low education • Impaired functional status • Heavy alcohol consumption • Lack of Social/Emotional Support www.phoenix-center.org
HRS Survey 2006 www.phoenix-center.org
Internet Use by Older Americans http://www.pewinternet.org/~/media//Files/Reports/2009/PIP_Generations_2009.pdf www.phoenix-center.org
Internet Adoption Among the Elderly • International Broadband Adoption (Policy Paper No. 33) • AGE reduces adoption, and has the largest effect other than income (but many elderly have low incomes, and income is held constant in the model) • AGE has the highest contribution to explaining the variation in broadband adoption across OECD members (partial R2) • In the HRS sample used in this paper, AGE has the second largest partial-R2 in the Internet Use equation www.phoenix-center.org
Usage Types by Age (Pew) www.phoenix-center.org
What We Know Social support/interaction is important for reducing depression Depression is common among the elderly Depression is costly The Internet facilitates social interaction and communication The Elderly are less likely to use the Internet, but use it for communications/health info when they do Federal money is available to expand Internet use among the “Aged” www.phoenix-center.org
Does Internet Use Reduce Depression? www.phoenix-center.org
Data • Health and Retirement Study (“HRS”) • Bi-annual Survey of 22,000 persons over 55 • Internet Use Variable • “sending or receiving e-mail or for any other purpose” • Dummy Variable • No “Broadband” indicator • Depression • Center for Epidemiologic Studies (CES-D) Score • 8 Point Scale • Converted to a Dummy Variable (CES-D ≥ 4) • Future research to estimate in natural state www.phoenix-center.org
What are We Interested In? • Are the Elderly using the Internet less likely to report symptoms of depression? • Can we estimate a causal effect, rather than just correlation? • Correlation: Two variables (X, Y) move together • Causation: Variable X causes variable Y • Why bother? • Policy typically aims impose a treatment (X) to cause an particular outcome (Y) arising from that treatment • We change X (ΔX) to change Y (ΔY) • Clearly important that we determine causal relationship, not just correlation. Otherwise, the policy may be ineffective. • Expanding Internet Use is costly – need to find offsetting benefits to pass the cost-benefit test www.phoenix-center.org
So What’s the Difficulty? • Those that choose to use the Internet users are likely different in many ways from those that do not, so there’s a risk of confusing those differences with the effect of Internet Use • With random assignment, problem is easy because sample member “characteristics” do not determine assignment • We have an observational data where a choice is made by the sample member • What if mental state determines Internet use? (endogeneity) • What if Internet use is positively related to education, and education determines Mental State? (confounding) • If treatment is not randomly assigned, we need to make some adjustments to the analysis to account for this fact www.phoenix-center.org
Differences in Treated/Control Groups Treated Sample Control Sample What if the Greens and Yellows tend to be more depressed than the Blues and Reds, and the Blues and Reds are more interested in the Internet? www.phoenix-center.org
Differences in Treatment/Control Groups www.phoenix-center.org
Illustration of Problem Treated Sample Control Sample With Internet Without Internet With Internet Without Internet 5% Depressed 15% Depressed 9% Depressed 19% Depressed We only observe these outcomes. www.phoenix-center.org
Example of Problem: Bias With Internet Without Internet 5% Depressed 15% Depressed = -0.10 Treated Sample 19% Depressed = -0.14 Control Sample Selection Bias = 0.04 www.phoenix-center.org
Getting the True Treatment Effect • Conditional Independence Assumption • Outcomes are independent of the treatment conditional on factors X • Y0, Y1 T | X • Random Assignment: Y0, Y1 T (don’t need the X’s) • Weaker Form: Y0 T | X (use control group to project Y0 on treated) • Unconfoundedness; Ignorability; Exogeneity; … • Overlap • For each value of X, there are both treated and untreated cases • E.G., Treated (High Income), Untreated (Low Income) • Regression estimates sensitive to low covariate overlap • Conditional Mean Assumption • Expected Untreated Outcome is the same for Treated and Untreated Cases given X (or by random assignment) www.phoenix-center.org
Empirical Approaches • Regression • Add the X’s to the analysis to satisfy assumptions • Instrumental Variables • Regression with more effort to satisfy assumptions when simple regression doesn’t solve the problems • Find/Create a “cleaner” Treatment Indicator • Propensity Score Methods • Compute probability of getting the treatment and modify the sample or estimation approach to satisfy the assumptions • Make sure Covariate Overlap is satisfied www.phoenix-center.org
Regression With Internet Without Internet 5% Depressed 15% Depressed = -0.10 Treated Sample 19% Depressed = -0.14 Control Sample Selection Bias = -0.04 Effect of X’s = 0.04 Bias Adj. for X’s = 0.00 www.phoenix-center.org
Propensity Score MatchingGet the Samples to Look Like Random Assignment Treated Final Control Final Clone www.phoenix-center.org
IV and PSM Procedures • First Stage: • Estimate an equation to explain Internet Use by regression analysis • Second Stage: • Use the “predictions” from this regression in estimating the treatment effect (this the Propensity Score) • Instrumental Variables: Prediction is used in place of Internet Use Variable • PSM: Prediction is used to modify or weight the sample • Simple Regression • Only Second Stage Applies • Just estimate treatment effect www.phoenix-center.org
Internet Use Equation: Variables Age Debilitating Health Condition Age*Health Income, Income2 Poor Dummy Married w/ Spouse Number of Marriages Male Education Seasonal Depression (Nov, Dec, Jan) People in home Race = Black Living family members 9 Census Region Dummies www.phoenix-center.org
Internet Use Equation • Sample Restrictions • Self Respondents, Age >= 55, Not in Nursing Home, Retired-Not Working • About 7,000 observations • Hosmer-Lemeshow Test • Null: “The Model is Correctly Specified” • 2 = 7086, Prob = 0.75 (Cannot Reject Null) • Receiver Operator Curve • ROC = 0.79 • Model distinguishes between Treated/Untreated Well • Instruments are “Good” www.phoenix-center.org
Single Equation Methods • Depression Equation • Regressors: Age, Married, Marriages, Education, Male, Health, Seasonal Depression • Treatment: Dummy for Internet Use • Logit Model • Accounts for 0/1 nature of Outcome • Coefficient on INTUSE = -0.34 (t = -3.8) • 25% reduction in depression categorization • Linear Probability Model • Ignores 0/1 nature of Outcome • Coefficient on INTUSE = -0.031 • 20% reduction in depression categorization at sample mean www.phoenix-center.org
Instrumental Variables Replace Internet Use variable with prediction from Internet Use regression: p(X) The INTUSE variable is now predicted from another model, so we use Murphy-Topel Covariance Matrix for hypothesis testing which takes this into account Coefficient = -0.223 (t = -2.9) 19% reduction in depression categorization www.phoenix-center.org
Propensity Score Methods: Trimming • Get Rid of the Extremes (Crump et al 2009) • Estimate only with 0.10 < p(X) < 0.90 • Toss out those with very low or very high probabilities of Internet Use • Extreme p(X) are likely caused by extreme values of the X’s, and observations are likely to be very different in treatment selection • Should Improve Covariate Balance • Results: • Improves but does not produce balance within tolerance for all variables • Regression methods are used, so balance is less a problem • Estimated Impact is only slightly smaller www.phoenix-center.org
PSM: Subclassification • Divide sample into sub-groups (e.g., quintiles) based on the Propensity Score to create balance in X’s • Estimate the effect on subclasses of the sample that look more alike (studies show reducing most of the selection bias) • Covariate Overlap is Good with Quintiles (5 groups) • Block Estimator • Weighted sum of Means Difference for each quintile • Subclassification with Regression • Add in some X’s and estimate regression on quintiles • Block Estimate = -0.365 (2= 11.889), -25% • Sub-w-Regression = -0.402 (2= 13.113), -26% www.phoenix-center.org
PSM: Matching • Matching finds a control group observation for every treatment group observation (if possible) based on proximity of p(X) • Tests indicate that the matching algorithms do what they are intended to do for this sample • Radius Matching (r = 0.001) = -0.031 (t = -2.7) • 24% reduction in depression categorization • Radius Matching (r = 0.000083) = -0.026 (t = -1.8) • 19% reduction in depression categorization • Kernel Matching (bw = 0.015) = -0.022 (t = -2.0) • 19% reduction in depression categorization www.phoenix-center.org
PSM: Matching with Regression • Use the matched sample in a regression analysis • Should reduce variance of estimator • Radius Matching (r = 0.001) = -0.031 (t = -3.2) • Coefficient Estimate = -0.348* (-24%) • Radius Matching (r = 0.000083) = -0.026 (t = -1.9) • Coefficient Estimate = -0.256* (-17%) • Kernel Matching (bw = 0.015) = -0.022 (t = -2.6) • Coefficient Estimate = -0.261* (-19%) www.phoenix-center.org
Summary • Wide variety of methods used, but all render similar results • About a 20% reduction in depression categorization from Internet Use • We have gone to great effort to measure “causal” effect and not just correlation • Result is robust, which is important with PSM analysis • Future Research • Alternative Estimation Methods • Find Other Outcomes of Interest • Longitudinal Data • Policy Impact • Social or Private? • Quantification of benefit to compare to cost of Internet Use programs www.phoenix-center.org