Download

1 / 46
460 likes | 607 Views
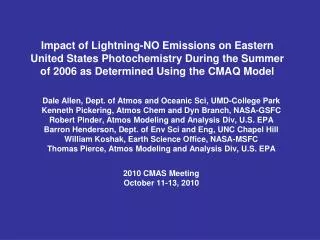
Impact of Lightning-NO Emissions on Eastern United States Photochemistry During the Summer of 2006 as Determined Using the CMAQ Model. Dale Allen, Dept. of Atmos and Oceanic Sci, UMD-College Park Kenneth Pickering, Atmos Chem and Dyn Branch, NASA-GSFC

E N D
Impact of Lightning-NO Emissions on Eastern United States Photochemistry During the Summer of 2006 as Determined Using the CMAQ Model Dale Allen, Dept. of Atmos and Oceanic Sci, UMD-College Park Kenneth Pickering, Atmos Chem and Dyn Branch, NASA-GSFC Robert Pinder, Atmos Modeling and Analysis Div, U.S. EPA Barron Henderson, Dept. of Env Sci and Eng, UNC Chapel Hill William Koshak, Earth Science Office, NASA-MSFC Thomas Pierce, Atmos Modeling and Analysis Div, U.S. EPA 2010 CMAS Meeting October 11-13, 2010
Outline Motivation & Background Describe method used to parameterize lightning-NO emissions within CMAQ Show impact of lightning-NO emissions on tropospheric composition over the U.S. during the summer of 2006 by comparing results of EPA simulations with and without lightning-NO emissions Compare model trace gas distributions with tropospheric NO2 columns from OMI aboard Aura ozone measurements from IONS field campaign tropospheric ozone profiles from TES aboard Aura Estimate the contribution of lightning-NO emissions to 8-hour maximum ozone Discuss future plans
Motivation for Including Lightning NOx in CMAQ Lightning NOx emissions have been added to EPA’s Community Multi-scale Air Quality (CMAQ) model, motivated by the following: In the summer over the US, production of NO by lightning (LNOx) is responsible for 60-80% of upper tropospheric (UT) NOx and 20-30% of UT ozone (Zhang et al., 2003; Allen et al., 2010). Mid- and upper-tropospheric ozone production rates are highly sensitive to NOx mixing ratios. Inversion-based estimates of NO emissions from CMAQ simulations without lightning-NO emissions have large errors at rural locations (Napelenok et al., 2008). CMAQ-calculated nitrogen deposition is much too low when lightning-NO emissions are not included (e.g., Low-bias in CMAQ-calculated nitric acid wet deposition at NADP sites cut in half when lightning-NO was added). Lightning-NO emissions can add several ppbv to summertime surface ozone concentrations
CMAQ simulation of summer 2006 • Simulations of 2006 air quality performed at EPA under the management of Wyat Appel and Shawn Roselleas part of the Air Quality Model Evaluation International Initiative (AQMEII) http://aqmeii.jrc.ec.europa.eu/doc/AQMEII_activity_description.pdf • Version 4.7.1 of CMAQ used with CB-05 chemical mechanism • NEI-based emissions with year specific power plant emissions from CEMS and satellite-derived wildfire emissions • Chemical boundary conditions from GEMS (European-led assimilation effort) • http://ozone.meteo.be/meteo/view/en/1550484-GEMS.html • Met fds from v3.1 of WRF ARW with KF convective parameterization
CMAQ Lightning-NO emission Parameterization LNOx = k* PROD*LF, where k: Conversion factor (Molecular weight of N / Avogadros #) PROD: Moles of NO produced per flash LF: Total flash rate (IC + CG), where LF = G * αi,j * (preconi,j – threshold), where Precon: Convective precipitation rate from WRF threshold: Value of precon below which the flash rate is set to zero. G: Scaling factor chosen so that domain-avg WRF flash rate matches domain averaged observed flash rate. αi,j: Local scaling factor chosen so that monthly avg model- calc flash rate for each grid box equals local observed flash rate For these retrospective simulations, the observed flash rate is the NLDN-based total flash rate for June, July, and August 2006. Operational forecasts could use satellite-retrieved or NLDN-based climatological flash rates for a season as observations.
What is the NLDN-based total flash rate? • Hourly cloud-to-ground flash rates (CG) from the National Lightning Detection Network (US only) are mapped onto the CMAQ grid. • Hourly total flash rates (CG +IC) are estimated by multiplying the CG flash rate by (Z+1), where Z is the climatological IC/CG ratio Boccippio et al. [2001] determined by comparing satellite-retrieved (Optical Transient Detector instrument) total flash rates with NLDN CG flash rates. • Cautionary note: • Errors in NLDN-based total flash rate can be substantial as 1) IC flashes > CG flashes , 2) 1995-1999 data set, 3) OTD only samples a few percent of total flashes
LNOx Production Per Flash • Globally, lightning produces 2-8 Tg N / year (Schumann and Huntrieser, 2007) with a 5 Tg N / year source corresponding to a mean source of ~250 moles of N / flash. • However, recent cloud resolved chem modeling (DeCaria et al., 2000; 2005; Ott et al., 2007; 2009) of observed convective events (STERAO, EULINOX, CRYSTAL-FACE) and recent modeling of the INTEX-A period using GEOS-Chem, FLEXPART, RAQMS, MOCAGE [Singh et al., 2007] and GMI [Allen et al., 2010] indicates that midlatitude & subtropical lightning produces ~500 moles of N / Flash. • In these CMAQ simulations both IC and CG flashes are assumed to produce 500 moles of N based on the cloud-resolved modeling cited above. • Vertical dist of lightning emissions is assumed to be proportional to pressure and to the mean vertical distribution of flash channel lengths in the vicinity of the North Alabama Lightning Mapping Array (LMA)
Vertical partitioning of lightning-NO emissions Vertical distribution of flash channel length in the vicinity of the North Alabama LMA is used along with a direct relationship with pressure to determine the fraction of emissions to put into each layer from the surface to the CMAQ- predicted cloud top Segment altitude distribution for all flashes from Koshak et al. [2010]
NLDN-based Total Flash rate WRF-based Total Flash rate
NLDN-based Total Flash rate WRF-based Total Flash rate
OMI tropospheric NO2 products 1. OMI standard product [Bucsela et al., 2008; Celarier et al., 2008] 2. DOMINO product [Boersma et al., 2007] 3. DOMINO/ GEOS-Chem product (DP-GC) [Lamsal et al. [2010] 4. University of Bremen product [Kim et al., 2009]. Each algorithm begins with same slant columns Different methods used to remove stratospheric columns Different methods used to convert trop slant cols to overhead cols Yield different tropospheric vertical column amounts Comparisons of inferred surface NO2 concentrations from these products with surface layer North American measurements [Lamsal et al. 2010] indicates that: OMIstd >> DOMINO >> observations >> DP-GC OMIstd 70% > observations DOMINO 30% > observations DP-GC 5% < observations Note: Updated OMI standard and DOMINO products are in development.
Bias w/o lightning Bias with lightning
Comparison of CMAQ O3 with O3 from TES aboard Aura TES w/o Bias adjust CMAQ With LNOx Bias wrt TES for CMAQ with LNOx Bias wrt TES for CMAQ w/o LNOx Note: Model output has been processed through TES averaging kernel Due to limited retrievals, results are averaged over 4°x5° grid boxes
Mean summer 2006 enhancement of 8-hr maxO3 in CMAQ due to LNOx O3 enhancement (ppbv)
Poor AQ days All days
Summary • CMAQ’s LNOx algorithm captures diel and day-to-day fluctuations in flash rate • LNOx are responsible for ~20% of modeled summertime tropospheric NO2 column over the U.S. • Addition of LNOx to CMAQ eliminates bias between modeled and DP-GC tropospheric NO2 columns; however, results from 2004 comparison with INTEX-A obs indicate that considerable low-bias still remains in upper troposphere • Addition of lightning-NO emission contributes to 5-15 ppbv high-bias wrt TES and IONS in upper tropospheric ozone over the eastern U.S. • LNOx in CMAQ contribute < 5 ppbv of O3 to 8-hour max O3 on 96% of days. Contribution usually smaller on high O3 days
Future Work Assess sensitivity of results to chemical mechanism by repeating simulation using updated CB5 chem (currently CB5 overestimates PAN & NOx to HNO3 conversion rate) Develop on-line Lightning-NO algorithm to be included in next CMAQ release. Options for climatological, convective-precipitation based and observationally constrained flash rates Develop lightning-NO algorithm suitable for operational forecasts (will constrain using climatological flash rates) Provide output for use in inverse studies of NO emissions and for nitrogen deposition investigations
Acknowledgements Wyat Appel & Shawn Roselle of EPA: AQMEII simulations Ana Prados of UMBC: Gridding OMI std product Anne Thompson: IONS ozonesonde data, Dylan Jones: TES averaging kernels, L. Lamsal: DP-GC NO2 data. OTD/LIS data are from NASA/MSFC. NLDN data are collected by Vaisala Inc NASA Applied Science Air Quality Program