QTL Analysis for Silique Width in Brassica rapa CTF6 Linkage Groups A4 and A8
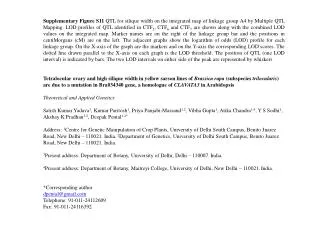
This supplementary figure presents QTL analysis for silique width in CTF6 linkage groups A4 and A8 using MQM. The graphs show LOD profiles for each linkage group, with marker names and positions in centiMorgans indicated. The yellow sarson lines of Brassica rapa with tetralocular ovary and high silique width are discussed, along with the role of the Bra034340 gene. The study is authored by Satish Kumar Yadava et al., affiliated with the Centre for Genetic Manipulation of Crop Plants at the University of Delhi South Campus, India.

QTL Analysis for Silique Width in Brassica rapa CTF6 Linkage Groups A4 and A8
E N D
Presentation Transcript
Supplementary Figure S8 QTL for siliquewidth in CTF6 linkage groups A4 and A8 by MQM. Marker names are on the right of the linkage group bar and the positions in centiMorgans (cM) are on the left. The adjacent graphs show the logarithm of odds (LOD) profile for each linkage group. On the X-axis of the graph are the markers and on the Y-axis the corresponding LOD scores. The dotted line drawn parallel to the X-axis on each graph is the LOD threshold. The position of QTL (one LOD interval) is indicated by bars. The two LOD intervals on either side of the peak are represented by whiskers Tetralocular ovary and high silique width in yellow sarson lines of Brassica rapa (subspecies trilocularis) are due to a mutation in Bra034340 gene, a homologue of CLAVATA3 in Arabidopsis Theoretical and Applied Genetics Satish Kumar Yadava1, Kumar Paritosh1, Priya Panjabi-Massand1,2, Vibha Gupta1, Atika Chandra1,4, Y S Sodhi1, Akshay K Pradhan1,2, Deepak Pental1,2* Address: 1Centre for Genetic Manipulation of Crop Plants, University of Delhi South Campus, Benito Juarez Road, New Delhi – 110021. India. 2Department of Genetics, University of Delhi South Campus, Benito Juarez Road, New Delhi – 110021. India. 3Present address: Department of Botany, University of Delhi, Delhi – 110007.India. 4Present address: Department of Botany, Maitreyi College, University of Delhi, New Delhi – 110021.India. *Corresponding author dpental@gmail.com Telephone: 91-011-24112609 Fax: 91-011-24116392
A4-CTF6 A8-CTF6 10 11 4 0 1 2 3 5 6 7 8 9 0 1 2 3 4 5 6 BrGMS867 At1g03180 0.0 0.0 BrGMS82 6.0 At1g08480 7.0 At2g39760 9.7 At2g40740 12.2 At1g11240 13.5 cnu_m524a 15.8 nia_m050a 17.5 cnu_m360a.1 19.7 BrGMS456.1 21.4 BrGMS181 At2g35990 25.0 25.1 At1g18340.1 27.9 At2g35770 28.1 cnu_m060a 31.0 At2g33620.2 31.6 cnu_m560a.1 33.4 BrGMS678 33.7 tet-o 36.0 sw At1g28530 36.2 At2g27170 38.5 BrGMS336 39.6 cnu_m518a 42.6 sw cnu_m239a 45.8 At5g40200 47.0 nia_m072a.1 cnu_m490a 48.1 48.4 At5g39220 50.2 At2g22000 52.0 cnu_m300a 52.6 At2g21120.1 53.0 At5g40740 55.8 At5g40950 BrGMS64 57.5 57.9 At2g44860 58.5 At5g37600.1 At1g53460 61.1 61.6 At5g40300 64.7 nia_m076a.2 66.9 cnu_m566a 79.6 cnu_m123a Supplementary Figure S8 QTL for silique width in CTF6 linkage groups A4 and A8 by MQM. Marker names are on the right of the linkage group bar and the positions in centiMorgans (cM) are on the left. The adjacent graphs show the logarithm of odds (LOD) profile for each linkage group. On the X-axis of the graph are the markers and on the Y-axis the corresponding LOD scores. The dotted line drawn parallel to the X-axis on each graph is the LOD threshold. The position of QTL (one LOD interval) is indicated by bars. The two LOD intervals on either side of the peak are represented by whiskers