Download
1 / 28
280 likes | 421 Views
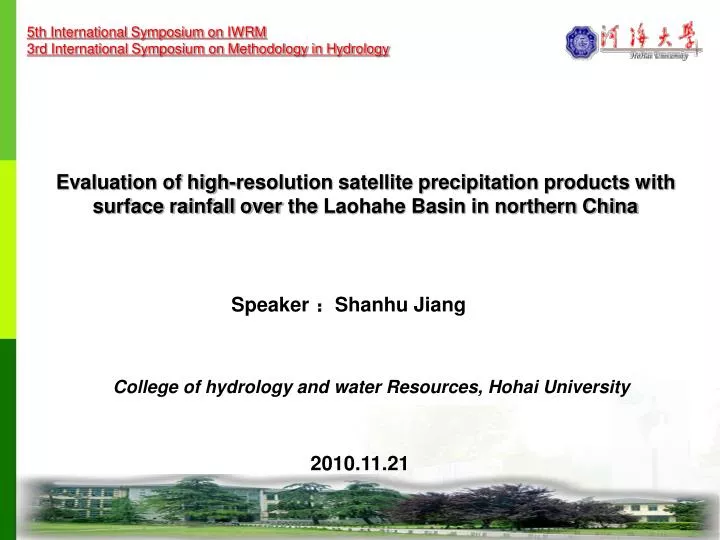
5th International Symposium on IWRM 3rd International Symposium on Methodology in Hydrology. Evaluation of high-resolution satellite precipitation products with surface rainfall over the Laohahe Basin in northern China. Speaker : Shanhu Jiang.

E N D
5th International Symposium on IWRM 3rd International Symposium on Methodology in Hydrology Evaluation of high-resolution satellite precipitation products with surface rainfall over the Laohahe Basin in northern China Speaker:Shanhu Jiang College of hydrology and water Resources, Hohai University 2010.11.21
Outline Research background 1 Research methods 2 3 Results Analysis Main conclusions 4
Research background • Precipitation is an important physical process of the global hydrological cycle, and its spatial and temporal distribution has greatly impacted the land surface hydrological fluxes and states. Acquiring accurate and real-time precipitation is very important for researching global hydrologic cycle, mitigating world-wide drought and flood, simulating land surface hydrologic processes and understanding the global climate change.
How to obtain Precipitation Information? Rain gauge: point measurement, land only, hard to get the data Radar: limited coverage, mostly for the land (since 1950s; 1964-NSSL Doppler; 1988-NEXRAD; 2003- phased-array) Model simulation: Numerical Weather Prediction (NWP) or other models’ simulation, but these data with bigger bias Satellite: Near global coverage, no hydro-geopolitical boundary, but its precision should be evaluated
Objective of this Study 1. Provide a comprehensive evaluation of three high resolution satellite precipitation products with the dense gauge observations over the Laohahe Basin in northern China. 2. Evaluation of the utility of the three high resolution satellite precipitation products for streamflow simulation. Can their errors be tolerated by a widely used hydrologic model at daily and monthly scales and how the errors propagate into hydrologic prediction?
Map of the Laohahe basin, topography, rain gauge station locations, and sampling strategies used in this study. Black squares represent the 16 selected 0.25o×0.25o grids for precipitation comparison. Numbers are grid IDs (e.g. 0301 indicates the first grid containing 3 gauges and 0302 represents the 2nd grid containing 3 gauge stations and so on).
Three satellite precipitation products used in this study TRMM precipitation products :3B42RTand 3B42V6 Precision:3-hourly, 0.25o×0.25o Range :50oNS. NOAA CPC Morphing Technique:CMORPH Precision: 3-hourly, 0.25o×0.25o Range :60oNS. 1) The near Real-Time product(i.e. 3B42RT) 3-9 hours after real-time, Jan 2002 to present; 2) The research-quality product (i.e. 3B42V6) about 10–15 days after the end of each calendar month,Jan 1998 to present; 3) The near Real-Time product(i.e. CMORPH)about 18 hours after real-time, Dec 2002 to present.
Other data used in this study Hydrological and Meteorological data: The surface observed daily precipitation data for 1990-2008 recorded by 52 rain gauge stations were prepared, daily streamflow for 1990-2008 of the Xinlongpo hydrologic station was prepared, meteorological data were obtained from four national standard meteorological stations within the Laohahe Basin. Land use、Soil and DEMdata: Soil types were derived from the Food and Agriculture Organization (FAO) data set and vegetation types were obtained from the University of Maryland’s 1 km Global Land Cover Production . The DEM data was obtained from the US Geological Survey GTOPO30.
Five widely used validation statistical indices The correlation coefficient (CC) is used to assess the agreement between satellite precipitation and gauged observations. The mean error (ME) and mean absolute error (MAE) measure the average magnitude of the error. The relative bias (BIAS) describes the systematic bias of the satellite precipitation. The Nash Sutcliffe coefficient (NSCE; Nash and Sutcliffe, 1970) displays the consistency of the satellite precipitation and gauge observations both at amount and temporal distribution.
Five categorical statistics indices The POD represents how often the rain occurrences were correctly detected by the satellite, and we also call it “hit rates”; the FAR denotes the fraction of cases in which the satellite records rainfall when the gauges do not; the CSI shows the overall fraction of correctly diagnosed events by the satellite; ETS shows how well the satellite rainfall events correspond to the gauge observations; HK displays how well the satellite estimates discriminate between rain and no-rain events.
Results Analysis • So, we firstly have a comprehensive comparation of the satellite precipitation products with the gauge observations at the 16 selected grids within the Laohahe Basin from 2003-2008.
these three satellite precipitation products perform very well in detecting the occurrence of the rainfall events, while there are some different biases in rainfall amount, the 3B42V6 having a bias of 21% fits the best with the gauge observations both at daily and monthly scales, while, the biases of 3B42RT and CMORPH (with the values of 81% and 67%, respectively) are much higher than a normal receivable threshold. Scatter plots of the precipitation between gauge observations and the three different satellite precipitation products at daily and monthly scales at the 16 selected grids within the Laohahe Basin from 2003-2008. (V6>CMORPH>RT)
Temporal evaluation of average monthly precipitation for the gauge observations, V6, RT and CMORPH at the 16 selected grids within the Laohahe Basin from 2003 to 2008: (a) Monthly precipitation time series; (b) Monthly precipitation mean error; (c) Monthly correlation coefficient (simulated at daily scale).
Similar with the front figure, but for mean monthly precipitation , ME and correlation coefficient (computed at daily scale) of the V6, RT and CMORPH satellite precipitation products and gauge observations for the year of 2003-2008.
Results Analysis Yearly values of correlation coefficient , ME (mm/day), MAE (mm/day), BIAS and NSCE statistics for the V6, RT and CMORPH precipitation products at daily scale
Results Analysis Scatter plots of the precipitation between gauge observations and the three different satellite precipitation products at daily and monthly scales at the 16 selected grids within the Laohahe Basin for the year of 2006.
Results Analysis • Next, we will have an evaluation of the utility of the satellite precipitation products for streamflow simulation within the Laohahe Basin. We selected VIC model for streamflow simulation. VIC model is a macroscale hydrologic model that solves full water and energy balances.
Grid Cell Vegetation Coverage Grid Cell Energy and Moisture Fluxes 2 1 ... 1 N N+1 P Rs RL RL Variable Infiltration Curve Ec S L i=im[1-(1-A)1/b] im Et i0+P W R P Infiltration Capacity Eb i0 W0 Three-Layer Variable Infiltration Capacity (VIC-3L) Model R Canopy 0 As 1 Fraction of Area i i Layer 1 Qb Baseflow Curve Qd Layer 2 Dm Qd Layer 3 Ds/Ws=1 Baseflow,B Ds/Ws<1 Qb DsDm 0 WsW3c W3c Layer 3 Soil Moisture,W3
The preparation of the VIC model Global control file evapotranspiration Soil moisture Forcing data:precipitation maximum T minimum T VICmodel routing runoff baseflow Routing files 水文参数 植被参数 气候地理参数 土壤参数 Soil、vegetation parameter files The inputs and outputs of the VIC model
Daily Monthly Observed and VIC model simulated streamflow with the gauged precipitation for calibration period (1990-1999): (a) daily time series; (b) monthly time series.
Results Analysis Observed and VIC model simulated streamflow with the gauged precipitation for the validation period (Jan. 2003-Dec. 2008, monthly time series). The observed streamflow was much smaller than the simulated streamflow for the effects of the human activities within the Laohahe Basin during the validation period.
Results Analysis We just selected the 2008 as a case study to prove the effects of human activities on the streamflow: daily and monthly precipitation and observed runoff series : (a) daily time series, (b) monthly time series.
Impacts of human activities on river streamflow of the Laohahe basin since 2000: (a) reservoir and dam for water storage and power generation; (b) increased trend for agricultural irrigation; (c) development of new industries; (d) dried up main channel of the Laohahe River in the rainy season of summer.
Results Analysis • So, we can’t use the observed streamflow to evaluate the hydrological prediction utility of the three satellite precipitation products. We just use theVIC model reconstructed streamflow with the gauge precipitation for the validation period to instead of the observed streamflow for the evaluation.
VIC reconstructed streamflow with the gauge precipitation for the validation period and VIC simulated streamflow with V6, RT and CMORPH: (a) daily time series; (b) monthly time series for the year of 2003 to 2008.
Main conclusions • We have evaluated three widely used satellite precipitation products (TRMM 3B42V6, RT and CMORPH). The V6 with a monthly bias adjusted by using global 6700 rain gauge observations is the best,and the RTand CMORPHhave bigger biases. • The hydrologic prediction utility evaluation shows that:the hydrologic prediction utility of theV6is the best; the VIC model can tolerate the relatively small error of the V6 rainfall inputs and generate bias-corresponded streamflow through hydrologic integration processes in the basin; in contrast, the hydrologic simulation generated high output errors for the RT and CMORPH data. • For having a better application of the RT and CMORPH in hydrologic simulation, a bias Adjusted or a land data Assimilation is needed in some regions.
Future works plan • 1. Corrected the real-time systematic biases of the RT and CMORPH products at daily to yearly time scales by using the BIAS corrected method. • 2. Do an assimilation for the real-time RT and CMORPH products by using Kalman filtering method.