Download
1 / 36
360 likes | 500 Views
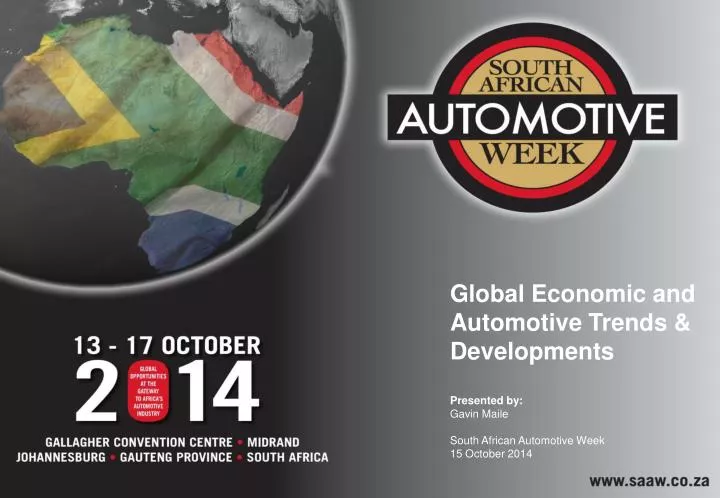
Global Economic and Automotive Trends & Developments Presented by: Gavin Maile South African Automotive Week 15 October 2014. Global Economic and Automotive Trends & Developments Agenda. 1. Global, African & South African Economy. 2. Global Automotive Trends & Developments.

E N D
Global Economic and Automotive Trends & Developments Presented by: Gavin Maile South African Automotive Week 15 October 2014
Global Economic and Automotive Trends & DevelopmentsAgenda 1. Global, African & South African Economy 2. Global Automotive Trends & Developments 3. KPMG Global Automotive Executive Survey 2014
Some news headlines about the global economy Global economy one shock away from another crisis – The Telegraph Global economy getting better, Barclays says Global economy may need stimulus – Business Day Two charts that show the world’s economy is thriving – Business Spectator Outlook for global economy remains uneven - IMF Is world economy heading for another economic crisis? – The Daily Star Manufacturing spearheads stronger global growth – Saxo Bank
Global outlook: main messages from the GEP (Worldbank) “Shifting priorities, building for the future”
Global economy: GDP growth forecasts (Worldbank) 2.4% 5.4% 3.4% Growth outlook revised downwards from 3.8% at the beginning of the year to a more modest 3.4% in July. The recovery is continuing, but momentum has slowed down and there are risks that might derail the move towards a healthier economy. Growth outlook revised upwards from 4.8% at the beginning of the year to a more aggressive 5.4% in July. Capacity constraints, slower local reforms and political tensions in some areas are, however, potential risks to the future growth outlook. Growth outlook revised upwards from 1.9% at the beginning of the year to 2.4% in July. Mixed signals and uneven recovery of developed economies, with patches of very exciting growth and patches of bad news.
The global powerhouses (World Bank) TOP 10 GLOBAL ECONOMIC SUPERPOWERS #8 #6 #4 #5 United States Projected GDP 2014: 17.5 trillion Projected GDP 2019: 22.1 trillion #9 #1 #1 #2 #3 China Projected GDP 2014: 9.1 trillion Projected GDP 2019: 14.8 trillion #10 #2 #7 Japan Projected GDP 2014: 4.9 trillion Projected GDP 2019: 5.7 trillion #3 Germany Projected GDP 2014: 3.6 trillion Projected GDP 2019: 4.9 trillion Brazil Projected GDP 2014: 2.2 trillion Projected GDP 2019: 2.9 trillion Russia Projected GDP 2014: 2.1 trillion Projected GDP 2019: 2.5 trillion Italy Projected GDP 2014: 2.1 trillion Projected GDP 2019: 2.6 trillion India Projected GDP 2014: 1.8 trillion Projected GDP 2019: 3.1 trillion United Kingdom Projected GDP 2014: 2.5 trillion Projected GDP 2019: 3.7 trillion #4 #10 #7 #8 #9 #6 France Projected GDP 2014: 2.7 trillion Projected GDP 2019: 3.6 trillion #5 Source: World Bank
How healthy is Africa? (Economist Intelligence Unit) Sub-Saharan Africa average annual GDP growth 2006 - 2013 10.6% Ethiopia 7.9% Sierra Leonne 6.3% Uganda 4.7% Kenya 7.7% Ghana 6.8% Nigeria 9.5% Angola 6.8% Tanzania 6.5% Zambia 7.2% Mozam- bique 3.7% South Africa Forecasted growth for 2014: 1.5% Q2 2014: +0.6% (lower than expected +0.9%) 6.2% Botswana 8.1% Forecast average annual GDP growth 2014 - 2019 7.1% 7% 7.0% 6.95% 6.9% 6.4% 6.1% 5.1% 6.0% 4.3% 2.65% 2.65% 2.65% 1.9% 1.5% 2.5% 1.45% Ethiopia Cameroon India Kenya France Brazil Germany Angola Russia Tanzania USA Cote D’lvoire China Nigeria Ghana South Africa United Kingdom Mozambique
South Africa: a story of confidence (or a lack thereof) (BER) BER’s BCI survey • The SACCI Business Confidence Index (BCI) • The BCI survey question: Respondents are asked to rate current business conditions as "satisfactory" or "unsatisfactory". • The index increased slightly to 89.2 in September from 89.0 in August 2014. • Although it appears that waning business confidence has been checked, business confidence remains at an undesirably low level • The BCI survey question: Respondents are asked to rate current business conditions as "satisfactory" or "unsatisfactory". • Respondents rated business conditions as unsatisfactory as the index is below 50. • However, it has increased by five points to 46 in 2014Q3. • This implies that close to 54% of respondents continued to be unhappy with prevailing business conditions. Neutral at 50 48 Sept 2014 Sept 2009 Sentiment among new vehicle dealers 15 pointsin the third quarter Confidence among wholesalers by 15 index points. Retailers, building contractors and manufacturers, the business mood by 11, 8 and 3 points respectively
South Africa: a story of confidence (or a lack thereof) (BER) BER’s CCI survey questions • How do you expect the general economic position in South Africa to develop during the next 12 months? • Improve considerably • Improve slightly • Deteriorate slightly • Deteriorate considerably • Don’t know 1 • How do you expect the financial position in your household to develop in the next 12 months? • Improve considerably • Improve slightly • Deteriorate slightly • Deteriorate considerably • Don’t know 2 Sept 2009 Sept 2014 What is your opinion of the suitability of the present time for the purchase of domestic appliances such as furniture, washing machines, refrigerators etc? Do you think that for people in general it is the right time, neither a good nor a bad time or the wrong time? 3 Neutral at 0 Consumer rating slipped from +4 to -1 index points during 2014Q3 The confidence levels of high income consumers remain notably higher compared to that of low income consumers, with wealthy consumers being particularly optimistic about the outlook for their household finances.
South Africa’s standing amongst developing economies (Economist Intelligence Unit) BRICS will represent 32% of global economic output by 2017 5thBRICS summit in Durban, BRICS bank and BRICS business council In 2010, South Africa joined an expanded BRICS group In 2009, the first BRIC summit was held Jim O’Neill of Goldman Sachs created and coined the term BRIC to identify the world’s fastest growing economies Source: Economic intelligence Unit
South Africa’s competitiveness (Global Competitiveness Report) Overall ranking 56 Restrictive labourregulations This little island is beating us Inadequately educated workforce Inefficient government bureaucracy Higher education 86 Innovation 43 Labour market 113 Financial markets 7 Health and education 132 Infrastructure 60 Economy 89 Institutions 36
Global Economic and Automotive Trends & DevelopmentsAgenda 1. Global, African & South African Economy 2. Global Automotive Trends & Developments 3. KPMG Global Automotive Executive Survey 2014
KPMG’s view on impending changes in automotive value chain FINANCIAL SERVICE PROVIDER SUPPLIER ORIGINAL EQUIPMENTMANUFACTURER CONVENTIONAL DEALER CAR RENTAL ANDFLEET PROVIDER TIER '0.5' NEWCOMER OEMs MOBILITY SERVICE PROVIDER IS ANDCONNECTIVITY NEW COMPONENTS SUPPLIER WEB 2.0 BROKER
KPMG’s view on impending changes in automotive value chain AUTOMOTIVE VALUE CHAIN SUPPLIER IS ANDCONNECTIVITY NEW COMPONENTS SUPPLIER TRADITIONAL PLAYERS • Tier 1 Suppliers • Vehicle and engine module / system manufacturing • Tier 2 Suppliers • Automotive parts manufacturing (suspension, steering and driveline) • Tier 3 Suppliers • Automotive parts manufacturing and raw material processing NEWPLAYERS • Electric Components and Light Weight Materials Suppliers • Batteries, e-motors, power electronics and semi-conducters • Carbon-fiber chassis and auto parts • Information Systems and Connectivity Companies • Telematics, wireless communication, infotainment, and mobile payment
Suppliers – Market Segmentation • Supplier Market Segments • Key Electric Components • KEY TRENDS Electric Motor Charger Li-ion BatteryPack Inverter+DC/DC+ EV Control ChargingStation New e-components very distinctive not
New Components – Electric Components • B • OEM Strategies to Access Battery and E-Component Know-How • Importance of Key Trends for Electric Components Suppliers • Top (Vehicle) BatteryManufacturers 2012 Make Buy Cooperate Source: Company website • BMW and Fiat-Chrysler buy battery technology from the South Korean battery specialist SB LiMotive instead of engaging themselves in the development and manufacturing of battery cells and packs. • Daimler operates two JVs with Evonik for battery packs and cells — Deutsche Akkumotive and LiTec Battery. • Daimler recently announced plans to form a JV with Bosch, to produce e-motors. • VW jointly develops lithium-ion batteries with Sanyo/Toshiba. • With three fully owned battery plants already operating in Europe, the Renault-Nissan Alliance tries to keep the battery production for their EVs in-house. • Newcomer OEMs such as BYD and Tesla Motors produce e-components in-house. very distinctive not
New Components – Light Weight Materials • B • Carbon Fiber as Future Light Weight Material in Automotive • OEM Strategies to Access Battery & E-component Know How • Selected Light Weight Materials Suppliers 2012 • Importance of Key Trends for Light Weight Materials Suppliers • Carbon fiber is strong, stiff and light and therefore well fit for automotive structural parts. • For example, BWM’s ‘project i’ under the project, environment-friendly models are developed and launched in mass leveraging carbon fiber also thinking beyond environmentally-conscious and agile driving. Sales Price: > US$55,000 Release Date: 2013 Range: ~ 100 miles Weight Reduction: > 400 lbs Advantages Disadvantages • Car weight reduction in favor of heavy but necessary auto parts (e.g. lithium-ion battery packs) • Increased fuel efficiency through lighter weight • Reduced exhaust emissions via higher fuel efficiency • Improved passive and active safety owing to higher material strength than aluminum or steel • Very high material costs (CFP component can cost nearly five times more than the same part made from aluminum) • Very time-consuming manufacturing cycle (e.g. hand-positioning layers of fiber, lengthy bonding process) • In contrast to aluminum or steel, no post-processing applicable (scrap can be around 30 percent) Source: Company website very distinctive not
IS and Connectivity – Overview • Tier 1 supplier Delphi and Autonet Mobile, a provider of internet-connectivity telematics, signed an agreement to develop and market a wireless connectivity platform, to deliver entertainment and downloadable content to vehicles in motion. • Hyundai and Microsoft jointly set up an ‘Automotive IT Innovation Center’ to develop next generation infotainment systems, including multimedia and navigation-related features. • Ford and Microsoft have already joined forces to equip Ford cars with a voice-controlled communications and entertainment system. Recently, they expanded their partnership to introduce an electricity grid management tool to Ford’s new electric models, which helps consumers to time car charging to periods when energy use is lower and therefore cheaper. • Bosch Group and Vodafone integrated their machine-to-machine (M2M) platforms, to offer businesses a simple way of wirelessly connecting products to the internet. • Trends toward Connected Cars • Possible application areas of connectivity-based technologies • Leveraging convergences via cross-sector partnerships “You get more and more connectivity between cars as well as between manufacturer and driver.” – Eberhard H. Kern, Mercedes Benz India, June 2013 • Modern cars are increasingly turning into smart and web-connected ‘mobile platforms.’ • OEMs try to integrate the trends in consumer electronics, in order to generate a new ecosystem of revenue as others may run dry in the future. • Importance of mechanical parts for future automotive value creation is decreasing. Shift in value creation in the Automotive Business Source: Press Release • Entertainment • Consumer electronics for passenger amusement in front and rear seats (e.g., iPod, satellite radio, TV and car PC system) • Safety / Security • In-vehicle tracking system (intelligent black box checking and tracking car conditions) • Personalization of car access and driver settings • Automatic security distance maintaining system (based on speed and weather conditions) • Home video alarm monitored from the car 2025 Software Electronical parts • Car maintenance and Optimization • Remote diagnostic application • Chips and controller for variable speed drive intelligence in order to produce Smart Motors that reduce energy consumption and CO2 emissions • Telemetry to collect vast amount of data to fine tune car performance monitoring 2010 Mechanical parts • Communication • Telephone video call, email, SMS, internet access to connect to remote users. • Commerce • Mobile payments system (charging tolls, parking fees, buying tickets, shopping) • Usage of the car recording system (miles per year, day of the week …) to be correlated with premiums for car insurance (e.g., every week, the car dashboard signals the cost of car insurance) • Infomobility • GPS navigations providing drivers info (news, available parking, alternative routes, shops, tourist areas, traffic situation, CO2 route optimization, points of interest, etc) Source: Reuters
KPMG’s view on impending changes in automotive value chain AUTOMOTIVE VALUE CHAIN ORIGINAL EQUIPMENTMANUFACTURER TIER '0.5' NEWCOMER OEMs IS ANDCONNECTIVITY NEW COMPONENTS SUPPLIER TRADITIONAL PLAYERS • Original Equipment Manufacturers • Vehicle and engine design, manufacturing, and assembly • Brand management • Several OEMsvertically integrate e-car value chain steps, from battery manufacturing to e-motor production • Supplier, dealer and customer financing via captive financial service arms NEWPLAYERS • Newcomer OEMs • Immature e-technologies and relatively low complexity allow newcomers to compete with established players • Tier ‘0.5’ Suppliers • Tier 1 suppliers upgrade to contract manufacturers • Complete car design and development capabilities, including production
OEMs – Global Market Segmentation • Light Vehicles (LV) • Light Vehicles includes both passenger vehicles and light commercial vehicles with at least four wheels, used for the transport of passengers and/or used for the carriage of goods. • Passenger Vehicles (PV) • Motor vehicles with at least four wheels, used for the transport of passengers, and comprising no more than eight seats, in addition to the driver's seat. • Light commercial vehicles (LCV) • Motor vehicles with at least four wheels, used for the carriage of goods. This limit depends on national and professional definitions and varies between 3.5 tons and 7 tons. • Definitions of Vehicle Types • LV Sales Development by Market Cluster* 2010-17e • PV Sales Development by Market Cluster 2010-17e • LCV Sales Development by Market Cluster 2010-17e 104 99 93 87 83 81 77 74 Source: Estimates, KPMG analysis 15.1 14.0 68.8 12.9 65.0 11.9 60.7 11.4 11.5 11.1 11.1 56.4 53.5 52.5 50.4 48.6 Source: LMC Automotive Q2 2012 Source: LMC Automotive Q3 2013 *Note: Vehicles unidentified are included in LV sales, however excluded from PV and LCV sales.
OEMs – Key Trends • KEY TRENDS very distinctive not
Tier ‘0.5’ – Overview Integration competence (supplies complex and critical vehicle systems Vehicle integration competence (capable of assembling and manufacturing entire vehicle) • Trend is shifting toward greater reliance of automotive OEMs on tier 1 contractors for development and supply of critical components or even completely outsourced model lines. • Over the past 15 years, more OEMs have undertaken contract manufacturing, as they have come under increasing pressure to develop new vehicles, particularly due to consumer preference for more distinctive models and in response to uncertainties in market conditions . • Tier ‘0.5’ suppliers are those suppliers who, besides providing modules for vehicles, have complete vehicle design and development capabilities, including vehicle production (contract manufacturing), such as Magna International, Valmet Automotive, Karmann and Pininfarina. • Porsche has been outsourcing its 987 Boxster and Cayman manufacturing to Finland-based contract manufacturer Valmet Automotive since 1997. As this contract will end in 2011, Magna Steyr will step in to produce Boxster / Cayman sports cars in Austria, as of 2012. • California electric car start-up Fisker Automotive has also contracted Valmet Automotive to assemble its Karma plug-in hybrid sports sedan in Finland. • Electric vehicle ‘Eva,’ developed in-house atValmet Automotive, demonstrates that contract manufacturers are striving for independent vehicle development, engineering and manufacturing. • Pininfarina, a leader in the production of niche vehicles, produces for Alpha Romeo (Spider), Ferrari (458 Italia) and Maserati (GranCabrio). • Shifting Responsibilities in Automotive Value Chain • Prominent Examples of Contract Manufacturing • Suppliers Move up Automotive Value Chain 2010 OEM Tier1 Tier3 Tier2 2015+ Tier ‘0.5’ OEM Tier1 Tier3 Tier2 Vehicle integration competence (capable of assembling and manufacturing entire vehicle) Technology leadership (supplies sub-systems and modules) Process or cost leadership (supplies parts and raw materials) “49 percent of 200 leading automotive executives believe that the future automotive value chain responsibilities will change significantly.” Source: KPMG‘s Global Automotive Executive Survey 2011
Newcomer OEMs – Overview • Technological Changes Open up Promising Opportunities for Newcomers What will disappear? What will change? What will be added? • Gearbox • Wheel suspension • Power transmission • Air condition systems • Cooling water pump • Thermal insulation • Chassis • Electric engine and related powertrain systems • Battery systems, including power electronics, battery management, charging devices (Plug-in) and DC / AC converter • Combustion engine parts, including the engine block, pistons, gaskets, valves, camshaft, oil pump, oil filter and injection systems • Exhaust system • Tank system • Clutch • Peripheral systems such as oil pumps, turbochargers and alternators Electrical engine: Powertrain with ca. 210 individual parts and 14 mechanical parts Combustion engine (six cylinders): Powertrain with ca. 1,400 individual parts and 140 mechanical parts • Reduction in Complexity • Less complexity could mean that supplier fragmentation will decrease (less need for a high number of specialists). This could increase profit margins overall. • With a young technology, all market participants start at the same level, and face similar challenges. • Newcomers have the same or better chances to succeed. • Mature technology with high entry barriers • Newcomers must close experience gaps
Newcomer OEMs – Current Examples • SABA Motors is a Silicon Valley Startup company developing high performance electric vehicles similar to Telsa Motor’s electric sports car. • The company promises to offer two-seat electric roadster that accelerates to 60 mph in five seconds and reaches a top speed of 105 mph • The car offers driving range between120 and 140 miles per charge. • BYD is a 15-year-old Hong Kong-listed battery maker that started producing BYD-branded electric cars, using its own batteries. • MidAmerican Energy, a unit of billionaire investor Warren Buffett's Berkshire Hathaway, surprised financial markets in 2008, with an agreement to purchase 10 percent of since then little-known BYD for USD 230 million. • BYD is working on launching its first plug-in all electric car, the E6, however, the time-frame is unknown. • Tesla Motors (Premium Electric Sports Cars) • SABA (Electric Sports Car) • BYD (Build Your Dreams) • Formed as a spin out from Rough and Tuff Electric Vehicles, headquartered in Atlanta, Georgia produced smart car called ‘The Life’ lookalike of electric car. • The Life is a two-seater car priced at US$32,995, with driving range of 100 miles. • The car is small in size reaching 65 mph top speed and is relatively highly priced compared to similar cars • Wheego Electric – The Life • Tesla Motors produces a high-performance electric sports car, and is backed by a number of high-profile investors. • In May 2012, introduced all new model S with improved efficiency and range. • In Dec 2012, reported an annual sale of US$385.7 million, an increase from US$148.6 million for the year ended Dec 2011. • In October 2013, announced the opening of the West Coast Supercharger Corridor, energizing a network of stations that enable Model S owners to travel for free between San Diego, California and Vancouver, British Columbia. • In October 2013, announced alliance with Panasonic to expand supply of automotive-grade battery cells. Source: CNBC Source: CNBC Source: Company website Source: CNBC
KPMG’s view on impending changes in automotive value chain AUTOMOTIVE VALUE CHAIN CONVENTIONAL DEALER CAR RENTAL ANDFLEET PROVIDER MOBILITY SERVICE PROVIDER IS ANDCONNECTIVITY NEW COMPONENTS SUPPLIER WEB 2.0 BROKER TRADITIONAL PLAYERS • Captive / independent dealerships • Showroom-bound vehicle marketing and sales • Vehicle maintenance services • Auto Rental and (Non-)Captive Financial Services Companies • Long-/short-term auto rental services • Leasing, financing and fleet management NEWPLAYERS • Mobility Service Providers • Intra-urban car sharing / club schemes or intermodal mobility solutions • Can be provided by OEMs, car-rentals, utilities, infrastructure providers, public transport companies or new entrants • Web 2.0 Brokers / Intermediaries • Vehicle brokerage via online distribution channels
Conventional Dealers – Overview • Dealer Market Segmentation • Key Trends at Global Level DealerGroups IndependentDealer OEM Captive Dealerships Multi-Brand Dealerships Used Car Dealerships End Customer
Conventional Dealers – Retail Market Overview • Key Difference – Mature and Establishing Retail Market • Car Parc Size and Density – Top 10 automotive market • Source: KPMG Global Automotive Retail Market Study
Mobility Service Providers – Overview • Growing Trend Toward Integrated Mobility Services / Solutions • Parameters for Mobility Concepts Intermodal mobility services (car + pub. transport) Carsharing, car rental, full-service-leasing Vehicle financing or leasing Car purchase + added value services (e.g. insurance)
Web 2.0 Brokers – Overview • More and better information is provided, such as vehicle reports by independent consumer associations and interest groups, direct product and service comparison. • A more comprehensive coverage of the market reduces the risk of customers overpaying. A web-based intermediary will immediately be able to tap a vast reservoir of potential buyers / sellers, and may thus realize substantial economies of scale in information provision. • It is easy to link with providers of value-added mobility services such as car insurance, finance, car pooling and maintenance centers. • The wealth of information on the web is complemented by traditional services; for example, some websites offer home delivery of new cars. • Emergence of Virtual Sales Channel • Advantages of Online Auto Brokerage for Customers WEB 2.0 Automotive Brokers Automotive InformationBrokers Automotive ServiceBrokers Companies that offer online information, pricing and a broker service to bring together potential buyers and sellers, but do not offer any additional services. They are purely infomediaries. Companies that offer online information, pricing and online quoting as well as additional services, such as financing, insurance, and a direct link to car dealers. Source: Cybermediation in Auto Distribution: Channel Dynamics and Conflicts
KPMG’s view on impending changes in automotive value chainSummary AUTOMOTIVE VALUE CHAIN FINANCIAL SERVICE PROVIDER SUPPLIER ORIGINAL EQUIPMENTMANUFACTURER CONVENTIONAL DEALER CAR RENTAL ANDFLEET PROVIDER TIER '0.5' NEWCOMER OEMs MOBILITY SERVICE PROVIDER IS ANDCONNECTIVITY NEW COMPONENTS SUPPLIER WEB 2.0 BROKER TRADITIONAL PLAYERS • Captive / independent dealerships • Showroom-bound vehicle marketing and sales • Vehicle maintenance services • Tier 1 Suppliers • Vehicle and engine module / system manufacturing • Tier 2 Suppliers • Automotive parts manufacturing (suspension, steering and driveline) • Tier 3 Suppliers • Automotive parts manufacturing and raw material processing • Original Equipment Manufacturers • Vehicle and engine design, manufacturing, and assembly • Brand management • Several OEMsvertically integrate e-car value chain steps, from battery manufacturing to e-motor production • Supplier, dealer and customer financing via captive financial service arms • Auto Rental and (Non-)Captive Financial Services Companies • Long-/short-term auto rental services • Leasing, financing and fleet management NEWPLAYERS • Electric Components and Light Weight Materials Suppliers • Batteries, e-motors, power electronics and semi-conducters • Carbon-fiber chassis and auto parts • Newcomer OEMs • Immature e-technologies and relatively low complexity allow newcomers to compete with established players • Mobility Service Providers • Intra-urban car sharing / club schemes or intermodal mobility solutions • Can be provided by OEMs, car-rentals, utilities, infrastructure providers, public transport companies or new entrants • Tier ‘0.5’ Suppliers • Tier 1 suppliers upgrade to contract manufacturers • Complete car design and development capabilities, including production • Information Systems and Connectivity Companies • Telematics, wireless communication, infotainment, and mobile payment • Web 2.0 Brokers / Intermediaries • Vehicle brokerage via online distribution channels
Global Economic and Automotive trends & developmentsAgenda 1. Global, African & South African Economy 2. Global Automotive trends & developments 3. KPMG Global Automotive Executive Survey 2014
KPMG’s Global Automotive Executive Survey 2014About the study About the study Geographic distribution of respondents Respondents job titles • KPMG International’s annual assessment of the current state and future prospects of the worldwide automotive industry. • In this year’s survey 200 senior executives from the world’s leading automotive companies were interviewed. Company category Company annual revenues Source: KPMG's Global Automotive Executive Survey 2014.
Key automotive trends up to 2025 The industry continues to be shaped by emerging markets. There is a sharp decline in the importance of pure battery e-mobility as automakers continue to turn their attention to improving ICE efficiency. STANDARDIZATION Increasing use of platforms and standardization of modules ICE OPTIMIZATION Downsizing and optimization of the internal combustion engine (ICE) EMERGING MARKETS 78% Market growth in emerging markets 76% 85% FUEL CELL E-MOBILITY 69% EUROPEAN PRODUCTION Rationalization of production in Europe and shifting of production to emerging markets 61% SELF-DRIVING CARS 14% MOBILITY 49% 59% Mobility-as-a-service 49% BATTERY E-MOBILITY 59% 57% CONNECTIVITY Connected car technologies (e.g. car-to-x communication) FINANCE & LEASING OEM captive financing and leasing URBAN VEHICLE Note: Percentage of respondents that rated a trend as ‘extremely important’ or ‘very important’ Innovative urban vehicle design concepts Source: KPMG's Global Automotive Executive Survey 2014.
Markets and consumers - the bigger picture: Consumers choose economy over innovation Factors influencing consumer’s purchase decision 73% 92% 79% 79% 7 4% Consumers have to choose between their conscience, their wallet and their status. Connected car solutions are gaining importance year-on-year. Fuel efficiency Safety innovation Ergonomics and comfort Vehicle styling/ exterior Environmental friendliness 70% 69% 65% 53% 47% Enhanced vehicle lifespan Plug-in solutions Vehicle-bound internet connectivity and built-in technologies Telematics/ personal assistance services Use of alternative fuel technologies Percentage of respondents that rated issues as ‘extremely important’ or ‘very important’ Source: KPMG’s Global Automotive Executive Survey 2014.
Evolving strategies for market success Ranking 2014 Ranking 2013 Business strategy Percentage Organic growth 84% 1 3 Automakers are refocusing from joint ventures and partnerships towards independent growth. Expansion of the value chain and diversification 77% 2 2 Corporate partnerships (JVs and partnerships) 3 1 77% Cooperation with players from converging industries 76% 4 6 Outsourcing of (non-)core activities 5 4 55% Mergers and acquisitions 50% 6 5 Note: Percentage of respondents that rated the strategy as ‘extremely important’ or ‘very important’ Source: KPMG’s Global Automotive Executive Survey 2014.
Thank youPresentation by: Gavin Maile Director+27 83 253 7165gavin.maile@kpmg.co.za