Download
1 / 20
210 likes | 671 Views
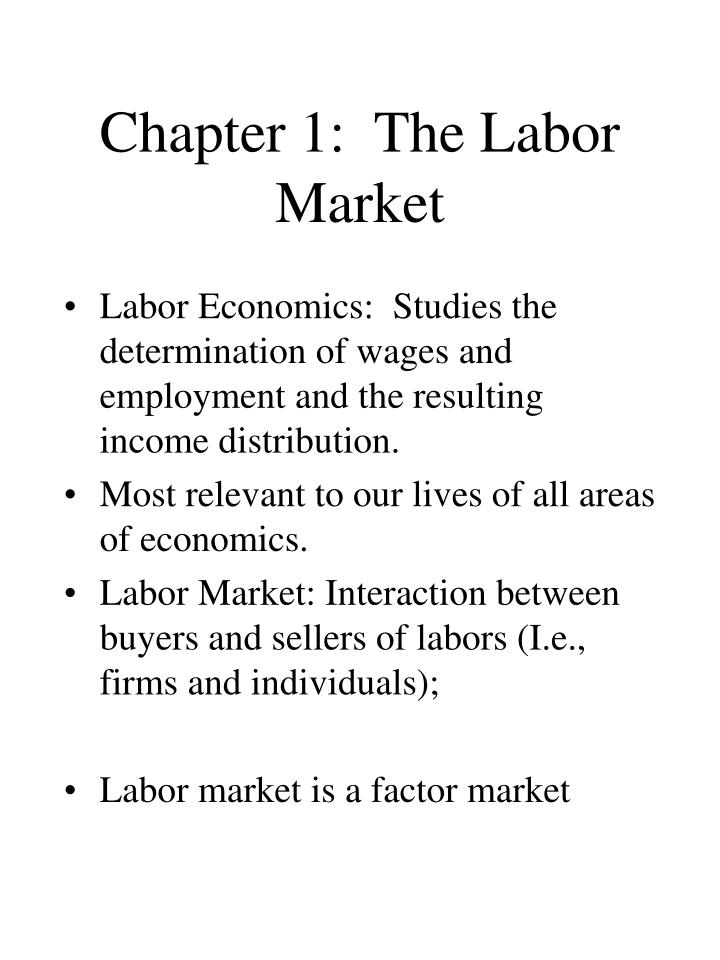
Chapter 1: The Labor Market. Labor Economics: Studies the determination of wages and employment and the resulting income distribution. Most relevant to our lives of all areas of economics. Labor Market: Interaction between buyers and sellers of labors (I.e., firms and individuals);

E N D
Chapter 1: The Labor Market • Labor Economics: Studies the determination of wages and employment and the resulting income distribution. • Most relevant to our lives of all areas of economics. • Labor Market: Interaction between buyers and sellers of labors (I.e., firms and individuals); • Labor market is a factor market
How Labor Market Differs from Other Markets • Sellers of labor are people • • Employment matches work better when they last awhile. • Much heterogeneity of workers and jobs • Many markets
5 Key Labor Market Outcomes • 1. Changing level and composition of labor supply – workers (trend over time). • 2. ing level and composition of labor demand – jobs (trend over time). • 3. ing Structure of earnings • 4. ing Labor-management relations • 5. es in the level and composition of unemployment
To Note in Figure 1.2 • Decline in average annual hours worked per worker • Trend in Labor Force Participation Rate (LFP) • 1. Decline for men: • 2. Increase for women: • 3. Increase in population with college degree (rising skill level):
To Note from Table 1.1 • Trend in level and composition of jobs
Structure of Earnings • #3 from earlier list. • How do earnings differ across workers, across occupations; how vary over time; and how do earnings differentials grow over time? • Example: in 1997, a pharmacist earned 5 times more per week than a child care worker. Why?
To Note from Figure 1.3 • Fluctuation in union wage premium over time: • Decline in percentage of the workforce that is in a union:
Why the Decline in Unionization over Time? • 1. Shift in type of jobs from manufacturing to services. • 2. Shift in jobs across regions. • 3. Government legislation that improved working conditions (decreased need for unions). • 4. Firms fight harder against formation of unions.
Level and Composition of Unemployment • Definition of unemployment: Person who is NOT working but is actively seeking work. • Unemployment rate: in the news all the time. • To note in Figure 1.4: • 1. Business cycle fluctuations. • 2. Differences for diff. groups. (e.g: teenagers; race)
WHY Have These Broad Outcomes Occurred? • Explain by studying the process by which the labor market operates. • 1. Market forces • 2. Institutional forces • 3. Sociological forces
Market Forces • Interaction of Supply and Demand • Demand for labor: by firms • A derived demand (demanded due to the output it will produce). • Recall from Micro Principles: Firms’ goal is to maximize profits • Supply side: Derived supply—workers supply labor because of what they can buy with the earned income. • Labor market works efficiently through changes in wages and mobility of labor.
Micro Review:Supply Curve • Shows quantity supplied at each possible price, ceteris paribus (c.p.). • Slopes upward: • Qs = Qs(P) • Shift S Curve if change c.p. factor • Movement along vs shift • C.P. factors:. • Interpret shift S curve:
Micro Review:Demand Curve • Shows quantity demanded at each possible price, ceteris paribus (c.p.) • Slopes downward: • Qd = Qd(P) • Movement along versus shift. • C.P. factors. • Interpret shift D curve:
Micro Review:Market Mechanism • Put Supply and Demand Together • Equilibrium • Point at which Qs=Qd; • Market-clearing P and Q; • Describe re-equilibrating process by changing C.P. factor: • Increase in income causes increase in demand (shift D rightward) • At old P, Qd greater than Qs: so individuals bid up price till reach new equilibrium.
Market Adjustment in Labor Market • Now price is wage and “Q” is labor. • Note initial We and Le. • 1. Show what happens if actual wage We (how market naturally moves to equilibrium). • 2. When in equilibrium, show what happens if DL shifts left.
Institutional Forces • Recall our list of three forces that affect the labor market process; this is second factor. • Any institution that alters the free adjustment process of wages and employment in the labor market. • Institutions can improve or impede adjustment • Example: internal labor market: hiring preference to applicants already working in firm. • Example: unions: bargaining power of workers.
Sociological Forces • How important are these forces? • Examples: • Read on own: Evolution of labor market theory.
Link to Politics • Relative importance of sociological forces: Leads to personal view regarding relative roles of market and government. • Differences in opinion are largely a matter of degree: HOW much government? • Two major U.S. political parties: • Republicans: more to market • Democrats: more to government
Push for Unbiased Answers • How to get past opinions to to get relative unbiased answers to policy questions? • Develop theory or model about how real world works, then test with data. • Example: What happens to employment if Wmin ?
Positive vs Normative • Positive statement: • Normative statement: • Sometimes hard to tell between the two.