Download
1 / 25
260 likes | 407 Views
A basic overview of Proteomics. Bioinformatics Unit Lab Meeting. F.M. Mancuso 21/02/2012 . The proteome is defined as the set of all expressed proteins in a cell, tissue or organism (Wilkins et al., 1997).

E N D
A basic overview of Proteomics Bioinformatics Unit Lab Meeting F.M. Mancuso 21/02/2012
The proteome is defined as the set of all expressed proteins in a cell, tissue or organism (Wilkins et al., 1997). Proteomics can be defined as the systematic analysis of proteins for their identity, quantity and function. Why proteomics? • Protein alterations cannot be fully deduced from DNA. • RNA expression does not always reflect protein levels (i.e. translational control,degradation, turnover,…) • Some tissues not suitable for RNA expression analysis. • Proteins are the physiological/pathological active key players. • General goal: • better understanding of genesis and progression of diseases • Clinical goals: • early disease detection (biomarkers) • identification of therapeutic targets • therapy monitoring
Applications of Proteomics • Mining: identification of proteins (catalog the proteins) • Quantitative proteomics: defining the relative or absolute amount of a protein • Protein-expression profile: identification of proteins in a particular state of the organism • Protein-network mapping: protein interactions in living systems • Mapping of protein modifications: how and where proteins are modified.
Top down or bottom up? Fragment ions of peptides • Bottom-up • Most common • Starting with proteolytic fragments • Piecing the protein back together • de novo repeat detection • Top down • Tandem MS of whole protein ions • Pulling them apart • Electron capture dissociation • Extensive sequence information MS/MS Bottom-up Proteolytic digest e.g. Trypsin Protein MS/MS Top down Fragment ions of protein ”Protein mass spectrometry" Wikipedia, The Free Encyclopedia. Wikimedia Foundation, Inc.
Typical MS experiment (I) Protein Identification (and quantitation)
Typical MS experiment (II) Quantification Identification Ionisation Separation Sample preparation Algorithms Cells, tissue MALDI, ESI HPLC TOF, Q, IT Bioinformatics Bioanalytics
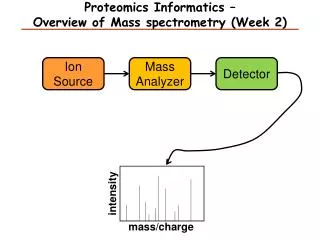
Ionisation Method Mass Analyser Data System Detector Mass Spectrometry (MS) Stages • Introduce sample to the instrument • Generate ions in the gas phase • Separate ions on the basis of differences in m/z with a mass analyzer • Detect ions Vacuum System Samples HPLC MALDI ESI
Mass spectrometers used in proteomic research AebersoldR. and Mann M., Nature (2003)
NL: 2.83E9 47.64 100 TIC MS RS_Contest_04 90 80 70 60 50 40 75.81 57.90 30 82.90 104.24 111.77 74.48 20 134.78 46.01 3.39 26.43 140.20 10 146.61 206.18 160.29 181.98 0 NL: 4.22E8 47.97 100 Base Peak m/z= 400.0-2000.0 F: + c 90 Full ms [ 80 400.00-2000.00] MS RS_Contest_04 70 60 83.07 50 40 82.07 30 70.11 85.56 102.41 126.89 46.01 20 43.63 134.78 29.48 144.13 10 27.29 163.97 172.59 19.24 181.98 197.48 0 0 20 40 60 80 100 120 140 160 180 200 Time (min) Data acquired - Chromatogram
Tandem mass spectra (MS/MS) can be used for peptide sequencing - Database Searching - De novo sequencing
Mascot • Scoring based on peptide frequency distribution from a non-redundant database (MOWSE – Molecular Weight SEarch) • The significance of that result depends on the size of the database being searched. Mascot shades in green the insignificant hits using a P=0.05 cutoff.
Quantitative Proteomics Kumar et al., FEBS Letters (2009)
Relative quantitation methods i.e. SILAC i.e. ICAT i.e. iTRAQ, TMT
Quantitation methods (II) Isotopic labeling Label-free analysis Yates JR, et al. Annu Rev Biomed Eng. (2009)
Common quantitative MS workflows Boxes in blue and yellow represent two experimental conditions. Horizontal lines indicate when samples are combined. Dashed lines indicate points at which experimental variation and thus quantification errorscan occur. Bantscheff et al., Anal BioanalChem (2007)
Generic data processing and analysis workflow for quantitative MS Yellow icons indicate steps common to all quantification approaches with or without the use of stable isotopes. Blue icons in the boxed area refer to extra steps required when using mass spectrometric signal intensity values for quantification. Bantscheff et al., Anal BioanalChem (2007)
Exploring quantitative proteomics data using bioinformatics Bantscheff et al.,Anal BioanalChem (2007) Kumar et al., FEBS Letters (2009)
ProteinQuantitationTool APEX proteinabundance estimate from LC-MS/MS data Java ASAPRatio (TPP)statisticalanalysisofproteinratiosfrom ICAT, cICAT, SILAC experiments C++ DAnTEproteinquantitation, statisticalanalysis and visualization .NET, R isobarquantitationof TMT and iTRAQ data and LaTeX report generation R IsobariQquantitationof IPTL, iTRAQ and TMT-labeledpeptides C++ Libra (TPP)analyzes 4- and 8-channel iTRAQ data MaxQuantquantitationfrom SILAC data fromThermoOrbitrap and FTICR MFPaQMascot file parsing and quantitationusing ICAT and SILAC Perl/.NET MSQuantproteinquantitationcombiningMascotresults and raw data fromstable isotope labeling .NET MS-Spectrequantitiaveanalysisof multiple LC-MS(/MS) analyses in mzXML Java Multi-QtoolformultiplexediTRAQ-basedquantitation .NET/Perl muxQuantmultiplexedquantitiaveproteomicsusingdifferentialstable isotope labeling C PEAKS Q peptide/proteinquantificationbyiTRAQ, ICAT, SILAC or label-free Java pepXML2Excelconverts output fromPeptideProphettoproteinlevel information in Excel AWK ProRatadifferentialproteomicsanalysisusingforvariousstable isotope labelingschemes PVIEW isotope labeled, label-free, XIC-basedquantitation C++ Quant MATLAB programforproteinquantitationbyiTRAQ MATLAB QUILanotherprogramfor relative quantitationusingstable isotope labeling RAAMSalgorithmforinterpreting O-16/O-18 differentialproteomics data C++ RelExcalculationofioncurrentratiosfrom LC-MS data (requiresXcalibur) XPRESS (TPP)calculates relative abundancesfrom ICAT, cICAT, SILAC and other N-14/N-15 experiments Msnbase Base Functions and Classes for MS-based Proteomics R …
Absolute quantitation (targeted proteomics) Selected reaction monitoring (SRM) or multiple reaction monitoring (MRM) is a method of absolute quantitation (also terms AQUA) in targeted proteomics analyses that is performed by spiking complex samples with stable isotope-labeled synthetic peptides that act as internal standards for specific peptides