Download

1 / 25
260 likes | 381 Views
Energy Requirement of Dairy Cows. In lactating dairy cows, it has been shown that energy is utilized for maintenance, lactation and pregnancy with approximately equal efficiency 60 – 70% with an average of 64.4%. Lactation. BW gain. Energy balance. 0. Maintenane Reqt 112 kcal ME

E N D
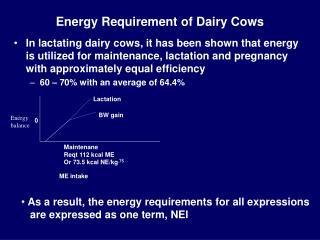
Energy Requirement of Dairy Cows • In lactating dairy cows, it has been shown that energy is utilized for maintenance, lactation and pregnancy with approximately equal efficiency • 60 – 70% with an average of 64.4% Lactation BW gain Energy balance 0 Maintenane Reqt 112 kcal ME Or 73.5 kcal NE/kg.75 ME intake • As a result, the energy requirements for all expressions • are expressed as one term, NEl
Energy requirements • Maintenance requirement • Related to body surface area or metabolic body size • Maintenance reqt. = .073 Mcal/kg.75 • Because this value was determined in cattle in metabolism stalls, a 10% activity allowance was included • 2001 says Maintenance reqt. For NEl = .08 Mcal/kg.75 • Example 650 kg cow • Maintenace reqt. for Nel = .08 x 650.75 = 10.3 Mcal • Activity allowance • Normally the 10% activity allowance is adequate • Additional energy is needed for grazing animals • Walking • Adjustment = .00045 Mcal Nel/kg BW/ horizontal km • Example • 650 kg x 4 km x .00045 = 1.17 Mcal • Eating • Adjustment = .0012 Mcal Nel/kg BW (Assumes 60% of diet is pasture) • Example • 650 kg x .0012 Mcal/kg BW = .78 Mcal • Factors like cow nutrient reqt., herbage allowance, herbage height, herbage quality, and terrain used by beef NRC weren’t used in dairy NRC
Walking on hilly terrain • ARC Adjustment = .03 Mcal NEl /kg BW/vertical km • 2001 Dairy NRC defines a hilly pasture as one in which the cattle move 200 m of vertical distance daily • Therefore, NRC use an adjustment of .03 x .2 = .006 Mcal/kg BW • Example • 650 kg cow x .006 Mcal NEl/kg BW = 3.9 Mcal NEl • Example % increase in maintenance Flat, close to parlor Hilly, far from parlor good pasturegood pasture Horizontal movement 2.8 11.4 Eating 7.6 7.6 Terrain - 37.9 10.4 56.9
Environmental adjustments • Cold stress • Because lactating cows have high heat production, the 2001 NRC felt that it was not necessary to adjust the nutrient requirements for cold • DM digestibility will decrease 1.8% units for each 10oC reduction in temperature below 20oC • 1989 NRC recommended that total Nel allowance be increased by 8% in cold weather, but 2001 NRC made no recommendation • Heat stress • Degree NEl cost, Mcal/day% increase in maintenance Mild .7 7 Severe 2.4 25 • Needs • Panting • Metabolic changes • Can’t be quantitated enough to develop an equation
Pregnancy requirement • Energy requirement increases from day 190 to 279 of pregnancy • Efficiency of ME use for pregnancy is quite low, 14% • Energy requirement • NEl (Mcal/d) = [(.00318 x D - .0352) x (CBW/45)]/(.14 x .64) • Day = Day of gestation • CBW = Calf birth weight in kg • Example DayNEl Mcal/d% increase in maintenance 190 6.09 59.2 230 7.45 72.4 270 8.82 85.6
Growth for 1st and 2nd calf heifers • Mature shrunk BW (MSBW) = .96 x MW • SBW = .96 x current BW • Standard reference BW (SRW) = 478/MSBW • Equivalent shrunk BW (ESBW) = (SBW –CW) x SRW/MSBW • Where CW = conceptus weight • Equivalent empty BW = .891 x ESBW • Equivalent empty BW gain = .956 x ADG • RE required = .0635 x EEBW.75 x EEBWG1.097 • Example • Mature weight 650 kg Gain RE Mcal/dMaintenance% increase 1st calf gaining .4 kg/d 1.82 9.02 20.1 2nd calf gaining .2 kg/d .90 9.58 9.4
Lactation requirement • NEl = .0929 x Fat% + .0347 x CP% + .0395 x lactose% • Simply added to maintenance • Theoretical efficiency for synthesis of milk components • Efficiency • Milk fat 81 • Milk protein 89 • Lactose 77 • Dietary ME to milk energy 64 • There is little variation in the efficiency of ME use over a broad range of diets • Mcal/kg DMME to milk energy, % • 2 60.8 • 2.6 63.0 • 3.0 64.0 • The utilization of ME for milk production and body tissue is subject to little variation • Variation in ME content accounts for 88% of the variation in NE • Total efficiency of ME use can not be regulated practically • But partitioning of energy between milk and body tissue is diet dependent
Solutions to early lactation energy deficiency • Because peak lactation occurs 6 to 8 weeks into lactation and peak feed intake occurs 8 to 12 weeks into lactation, it’s difficult to meet both the energy requirements and fiber requirements of high producing cows • Solutions • Limit maximum amount of grain to meet the fiber requirement and make up for the energy deficit at other periods of the lactation cycle • Cows in good condition (but not overly fat) can safely lose up to 100 kg body tissue (15% of BW) during the first 70 days of lactation
Calculation of energy from weight loss • Calculation of shrunk BW (SBW) = .96 x BW • Calculation of BCS on a 9 point basis (BCS(9)) = ((Dairy BCS – 1) x 2) + 1 • Empty BW at CS5 on a 9 point scale = (SBW x .851)/CSFx • Factors • CSF1 = .726 CSF2 = .794 • CSF3 = .863 CSF4 = .931 • CSF5 = 1.00 CSF6 = 1.069 • CSF7 = 1.137 CSF8 = 1.206 • CSF9 = 1.274 • Calculation of empty BW at CSx • EBWx = CSFx x CS5BW • Calculation of fat weight at CSx • Proportion of fat at CSx = Afx = .037683 x BCS9 • Weight of fat at CSx = TFx = EBWx x Afx • Calculation of protein weight at CSx • Proportion of protein at CSx =Apx = .200886 - .0066762xBCS9 • Weight of protien at CSx = TPx = EBWx x Apx • Tissue energy reserve at CSx= ERx = (9 x TFx) + (5.55 x TPx) • Energy available from1 CS loss on a 5 point scale = NEl = .82 x (ERCS9 – ERCS9-2)
Efficiency of ME use for replacement of energy loss differs in relation to stage of lactation when stores are replaced Efficiency Stage of lactationME to tissueTissue to milkTotal Late lactation 75 82 61.5 Dry 60 82 49.2 • Energy cost for tissue replacement during lactation = (.644/.75) x (ERCS9+2 + ERCS9) • Energy cost for tissue replacement during dry period = (.644/.60) x (ERCS9+2 + ERCS9) It is preferable to replace body energy stores during late lactation as opposed to the dry period. • Additional advantages to putting weight on during late lactation • Easier to feed grain to lactating cows • Because intake is higher, its easier to feed extra grain will not decrease forage intake.
Example • How much 4% fat-corrected milk can a 1450 cow produce from body tissue going from CS 3.5 to 2.5 on a dairy scale? • FBW = 1450/2.2 = 659 kg • SBW = 659 x .96 =632 kg • BCS(9) = ((3.5 – 1) x 2) +1 = 6 • BCS(9) = ((2.5 – 1) x 2) + 1 = 4 • CSF6 = 1.069 CSF4 = .931 • CS5EBW = 632 x .851/1.069 = 503.7 • EBW6 = 503.7 x 1.069 = 538.4 EBW4 = 503.7 x .931 = 468.94 • AF6 = .037683 x 6 = .2261 AF4 = .037683 x 4 = .1507 • TF6 = 538.4 x .2261 = 121.73 TF4 = 468.94 x .1507 = 70.684 • AP6 = .200886 - .0066762 x 6 = .1608 AP4 = .200886 - .0066762 x 4 = .1742 • TP6 = 538.4 x .1608 = 86.59 TP4 = 468.94 x .1742 = 81.68 • ER6 = (9.4 x 121.73) + (5.55 x 86.59) ER4 = (9.4 x 70.684) + (5.55 x 81.68) = 1624.84 = 1117.76 • NEl mobilized, Mcal = .82 (1624.84 – 1117.76) = 415.80 Mcal • Assuming 4% fat-corrected milk requires .74 Mcal NEl/kg then, Milk from tissue = 415.8/.74 = 561.9 kg • Dietary energy needed to replace tissue in • Late lactation = .644/.75 x (1624.84 – 1117.76) = 435.41 Mcal • Dry period = .644/.60 x (1624.84 – 1117.76) = 544.87
Balancing the ration for maximum NDF intake on a % BW basis • Allows more flexibility in forage to grain ratio • Considers fiber contribution from grain byproducts • Assumes that cows consume NDF at 1.2% of BW • But because of a .1% standard deviation, Mertens recommends using 1.1% of BW. • Example • Assume a 1500 cow • She will require 1500 x .011 = 16.5 lb NDF • If DMI = 2.8% BW, then % NDF in diet = 39.3% of DM • If DMI = 3.2% BW, then %NDF in diet = 34.3% of DM • If DMI = 3.6% BW, then %NDF in diet = 30.5% of DM • If DMI = 4% BW, then %NDF in diet = 27.5% of DM • 75% of NDF should come from forages • Do not allow dietary NDF to drop below 25% • In addition, the nonfiber carbohydrate should be between 30 and 40% of the dietary DM • Too low will cause inadequate microbial synthesis • Too high will cause milk fat depression or acidosis
Increase the energy concentration of the grain with fat and, thereby, cows will be able to consume adequate forage • NRC recommendations • Limit added at to 3 to 4 % of diet (600 – 700 gm) • Since normal diet contains 3% fat, total dietary fat should be limited to 6 – 7% of DM • Lactation response to fat is curvilinear with maximum milk yield occuring at 16% of ME from fat (600 – 700 gm) • Advantages of fat supplementation • Can maintain a higher proportion of forage in the diet • Fat test may be elevated • Particularly if ruminally protected fats are fed • Milk fat depression may occur after use • Fats increase dietary energy without increasing the heat increment • May improve reproduction • Mechanism • Decreases insulin and increase progesterone which increases follicle size and number • Decreases prostaglandin 52 alpha increases persistence of corpus luteum • May decrease first service conception if fat increases milk production
Problems with fat supplementation • Milk fat depression • Particularly a problem if unsaturated or unprotected fats are fed • Particularly a problem if low fiber diets are fed • Milk protein depression • Milk protein % = 101.1 - .6381x + .0141x2 where x = total dietary fat • Related to increase in milk production • Negative effects of fat on milk protein may be replaced by supplementing nicotinic acid (12 gm/d) or ruminally undegraded amino acids • Decreased feed intake • Mechanism • Decreased gut motility • Decreased palatability • Oxidation of fat in liver • Decreased cellulose digestion • Dependent on type of fat • Ca salts of fatty acids decrease DMI by 2.5% /each 1% CaLFA added • Unprotected fats reduced DMI by 1.25% /each 1% fat added • Saturated fats do not reduce feed intake • Oilseeds reduce feed intake quadratically with minimal intake at 2% fat • Decreased cellulose digestion • Decreasd digestion of Ca and Mg • If fat added, Ca and Mg should be added to diet • If unsaturated fat is added, Ca and Mg should be increased by 20 to 30%
Problems with added fats may be minimized by • Feeding fats that are inert in the rumen • Feeding in small amounts several times per day • Feeding fats in total mixed rations rather than as individual components • Choice of fat • Innertness • Decreased solubility increases inertness • Saturated fats are more inert than polyunsaturated fats • Ca salts of fatty acids are more inert than free oils • Whole oil seeds are more inert than free oils • Protein needs • If no protein is needed, use tallow • If undegradable protein is needed, use heated soybeans • If degradable protein is needed, use raw soybeans or cottonseed • Fiber needs • If fiber is needed, feed whole cottonseed • Because of gossypol, feed no more than 8 lb cottonseed/day • Price • Timing of fat feeding • Because fat reduces feed intake, fat supplementation is of little value for the first 5 to 7 weeks of lactation • Fat supplementation should be terminated early enough to prevent the cows from becoming excessively fat (BCS > 3.5)
Increase the proportion of concentrates in the diet and supplement the diet with: • Buffers • Increases rumen pH decreasing production of Trans-10 (18:1) FA and increases Acetate/Propionate • Buffers include sodium bicarbonate, sodium sesquicarbonate, magnesium oxide, and potassium carbonate • Most useful when diet is deficient in effective fiber or the animal is undergoing the transition from a high forage diet to a high grain diet. • Tend to be unpalatable and short-term responses • Undegraded choline
Nutrient repartitioningBovine somatotropin • Effects • Increases milk production • Dairy NRC says at 5 to 50 mg/d, milk production will increase by 3 to 6 kg/day • Monsanto data said that production would increase by 16% from day 60 to 312 post-partum • Increases feed and water intake • Major factor responsible for increased milk • Takes 3 to 5 weeks to develop • Increases feed efficiency • Effect of increased milk production diluting the effects of maintenance • No effect on nutrient utilization per se. • Decreases milk protein percentage • Increases mobilization of tissue reserves • Increases metabolic rate and body heat production • Increases heart rate and cardiac output • Increases milk production to the mammary gland • Affects reproduction • Reduces rebreeding rate • Increases twinning rate, particularly in heifers • Increases mastitis and somatic cell count
Factors affecting response to bst • Genetic merit • Nutritional status • Feed as a high producing cow • Cows should have access to feed for 20 hr/day • Management • Inject 500 mg bst-Zn every 14 days beginning 9 weeks into lactation • Do not give to cows in poor condition
Problems associated with energy intake by dairy cows • Milk fat depression • Causes • Shortage of energy plus utilization of body fat • Cows are thin, ketosis prone and high producing cows • Can be corrected by increasing dietary energy level or feed intake • Milk fat depression syndrome • Decreased forage to concentrate ratio and/or supplementing polyunsaturated fatty acids increase production of trans-10(18:1) fatty acids will inhibit mammary fatty acid synthesis • Factors • Inadequate effective NDF • Excessive carbohydrate energy (> 40% NFC) • Inadequate particle size (Forage harvested or ground at < ¼” theoretical length of chop; 75^ of NDF must come from forage) • Excess unsaturuated fatty acids • Dietary buffers will reduce problem
Ketosis-fatty acid liver • In early lactation, energy must be mobilized from tissue reserves Excessive use of tissue energy Lack of OAA Lack of carnitine Lack of niacin Overcomes limit of triglyceride to be: • transported from liver as VLDL • oxidized in TCA cycle in liver Fat accumulates Acetyl-CoA in hepatocytes (Fatty liver) Acetoacetate B-OH-Butyrate Impairs gluconeogenisis Impairs feed intake Appear in milk Reduces glucose Increased milk fever Increased displaced abomasum Increased retained placenta Increased mastitis
Symptoms • Metabolic profile NormalKetosis (2-4 weeks PP) Blood mg% Glucose 52 28 Ketones 3 41 Plasma Free fatty acids 3 33 Triglycerides 14 8 Free cholesterol 29 15 Cholesterol esters 226 150 Phospholipids 174 82 • Poor appetite • Loss of body weight • Gaunt and dull appearance • Irregular rumen contractions • May stagger or appear uncoordinated • Milk production will decrease • Complications • DA, milk fever, retained placenta, and mastitis
Reduced intake at calving • Intake decreases by 30% one to two days before calving and doesn’t return until one to two days after calving • NRC equation • DMI(%BW) = 1.97 - .75e.16t where t = Days pregnant – 280 • Ketosis prevention • Maximize intake immediately before calving • Avoid abrupt change to high grain lactation diet at calving • Feed balance ration • Use high quality forages • Avoid excessive fatness in cows • Drench cows with propylene glycol (1L/day) for 1 week daily before calving • Propylene glycol is metabolized to lactate that can be used for gluconeogenisis • Supplement with nicotinic acid (6 – 12 g/d) • Increases DMI • Reduces lipolysis • Recommendations • Use in ketosis prone cows • Use from 14 days prepartum to 120 days postpartum • Use palatable carrier
Displaced abomasum • Caused by the abomasum sliding to the left under the rumen after calving if the rumen fails to take up its normal space • Factors • Failure of rumen to take up space left as uterus retracts • Omentum attached to the abomasum may have stretched • Rumen atony • Diet • High grain diet in late gestation • Decreased contractions • Decreased intake causes less rumen volume • Decreased intake causes less Ca intake and therefore contractions • Inadequate forage in the diet • Decreased muscle tone in GIT • Decreased rumen mat results in less buffering and higher concentrations of VFAs
Reproductive difficulties Body condition loss, 1st 5 wk < .5.5-1.0> 1.0 Days to 1st ovulation 27 31 42 Days to 1st observed estrus 48 41 62 Days to 1st service 68 67 79 1st service conception, % 65 53 17 Services/conception 1.8 2.3 2.3 Pregnancy rate, % 94 95 100 • Physiogical effects of negative energy balance • Reduced secretion of luteinizing hormone LH amplitude, pg/ml = 339 + 25.3 x energy balance • Increased number of small follicles (3 – 10 mm) • Decreased number of large follicles (> 10 mm) Diam of largest follicle, mm = 9.24 + .56 x energy balance
Management • Have cows at appropriate condition Suggested CS range Calving 3 – 3.75 Peak milk yield 2.25 – 2.75 150 – 200 days of lactation 3 – 3.5 Dry period 3 – 3.5 • Feed for high feed intake • At equal energy balance, cows with highest feed intake and milk production have earliest estrus • Fat supplementation • Increases blood progesterone • Increases follicle size • Does not improve reproduction if fat causes increased milk production