Download
1 / 56
560 likes | 726 Views
Customer Satisfaction Index July 2008. RESULTS. Introduction This report presents the results for the Customer Satisfaction Index survey undertaken in July 2008. The objectives of the research were: For importance , find out customers’ requirements and their relative importance

E N D
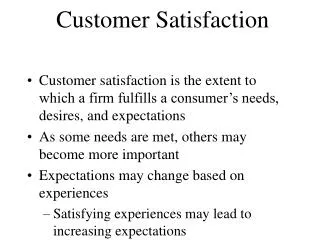
Introduction • This report presents the results for the Customer Satisfaction Index survey undertaken in July 2008. • The objectives of the research were: • For importance, find out customers’ requirements and their relative importance • For satisfaction, find out our customers’ perception of our performance • To create Priorities for Improvement (to deliver resident satisfaction and build loyalty organisations must match their performance with residents’ priorities and these PFIs are an indication of whether this is happening or not). Therefore, PFIs are extremely useful in deciding where best to focus resources on making the improvements that will contribute most to increasing resident satisfaction. • To create a Satisfaction Index (an overall measure of customer satisfaction which can be monitored over time) • A standard satisfaction survey just measures residents’ satisfaction with the services an organisation provides. However, a Satisfaction Index survey measures whether it is ‘doing best what matters most to their residents’.
Methodology The first survey of this kind for all public-facing services was undertaken in 2002. By building on this and to establish how important or unimportant chosen topic areas were to residents over time, focus groups have been held over the last few years. The first part of the discussions looked at the attendees’ feelings of satisfaction and dissatisfaction with the Council in various subject areas. The second part of the discussions concentrated on the relative importance of each of the topic areas to those individuals. It must be recognised that all the topics within the survey are important and in their own right should be priorities for the Council. However, the survey gives the Council a way of ranking these priorities and it is these which the Council must look to improve. In this instance, a 10 point scale has been recommended as good practice. A questionnaire was sent to 5000 randomly selected named residents off the edited electoral role. 895 questionnaires (2 less than 2006) were returned in the timeframe allowed (52 were undelivered for various reasons). A response rate of 18.1% was achieved. For the comparatively long length of questionnaire, this is an expected response. According to specialists in this field, a return of 15-20% is the norm for this sort of research. On an observed statistic of 50%, the standard error of +/-3% was achieved in this survey.
How we calculate the Customer Satisfaction Index • This example contains 10 requirements for a particular service: • Step 1. List all the average importance scores for each requirement and total them up. • Step 2. Calculate the percentage each average importance score is of the total of importance • scores. This is the “weighted importance score” and adds up to 100%. • Step 3. Multiply the average satisfaction scores by the weighted importance scores, i.e. average satisfaction score (6.22) multiplied by weighted importance score (11.01%) equals 0.68. • Step 4. Add up the weighted satisfaction scores. • Step 5. Multiply the total of the weighted satisfaction scores by 10 to give us the Satisfaction Index expressed as a percentage. • When using the 10 point scale for satisfaction, 7 is regarded as an “acceptable performance”, with 8 and above being the target to be achieved in the future.
OVERALL CUSTOMER SATISFACTION INDEX SCORES COMBINED COUNCIL AVERAGE - ALL RESPONDENTS (02-08) %
OVERALL CUSTOMER SATISFACTION INDEX SCORES BY SERVICE - ALL RESPONDENTS (JULY 2008) % COMBINED COUNCIL AVERAGE 2008 = 74.3% COMBINED COUNCIL AVERAGE 2006 = 73.3% Base: (895)
SERVICE COMPARISON OF 2008 CSI SCORE VS 2006 CSI SCORE ALL RESPONDENTS (difference in % score)
OVERALL CUSTOMER SATISFACTION INDEX SCORES COMBINED COUNCIL AVERAGE - USERS (02-08) %
OVERALL CUSTOMER SATISFACTION INDEX SCORES BY SERVICE - USERS (JULY 2008) % COMBINED COUNCIL AVERAGE 2008 = 70.4% COMBINED COUNCIL AVERAGE 2006 = 70.9%
SERVICE COMPARISON OF 2008 CSI SCORE VS 2006 CSI SCORE USERS (difference in % score)
Individual ResultsBy Service(All Respondents)The results for each service requirement are shown with the worst score first and the best score last. This creates our “Priorities for Improvement”.
ACROSS ALL SERVICES 2008 (ALL RESPONDENTS)
Individual ResultsBy Service(Users of a Service in Last 2 Years)
CUSTOMER SATISFACTION INDEX OVERALL SATISFACTION WITH COUNCIL SERVICES ALL RESPONDENTS (JULY 2006/2008) % COMBINED COUNCIL AVERAGE 2008 = 6.52 (Mean Score) COMBINED COUNCIL AVERAGE 2006 = 6.62 (Mean Score) COMBINED COUNCIL AVERAGE 2004 = 6.49 (Mean Score) COMBINED COUNCIL AVERAGE 2002 = 6.48 (Mean Score) Base: (846)
CUSTOMER SATISFACTION INDEX ADDITIONAL COMMENTS (JULY 2008) % Mentions 4% or more Base: (315)