Function Notation
Function Notation. Lesson 4.2. Rachel’s parents keep track of her height as she gets older. They plot these values on a graph and connect the points with a smooth curve.

Function Notation
E N D
Presentation Transcript
Function Notation Lesson 4.2
Rachel’s parents keep track of her height as she gets older. They plot these values on a graph and connect the points with a smooth curve. • For every age you choose on the x-axis, there is only one height that pairs with it on the y-axis. That is, Rachel is only one height at any specific time during her life.
A relation is any relationship between two variables. • A function is a special type of relation such that for every value of the independent variable, there is at most one value of the dependent variable. • If x is your independent variable, a function pairs at most one y with each x. You can say that Rachel’s height is a function of her age.
Vertical Line Test • You may remember the vertical line test from previous mathematics classes. It helps you determine whether or not a graph represents a function. • If no vertical line crosses the graph more than once, then the relation is a function. • Take a minute to think about how you could apply this technique to the graph of Rachel’s height and the two graphs at the right.
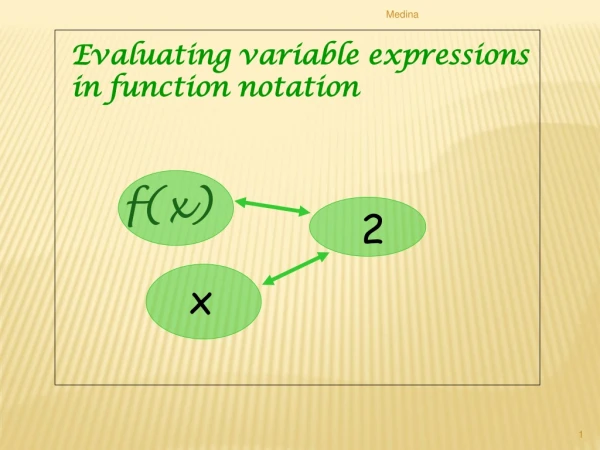
Function notation emphasizes the dependent relationship between the variables that are used in a function. • The notation y=f(x) indicates that values of the dependent variable, y, are explicitly defined in terms of the independent variable, x, by the function f. • You read “y=f(x)” as “y equals f of x.”
Graphs of functions and relations can be continuous, such as the graph of Rachel’s height, or they can be made up of discrete points, such as a graph of the maximum temperatures for each day of a month. • Although real-world data often have an identifiable pattern, a function does not necessarily need to have a rule that connects the two variables.
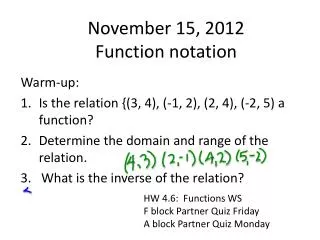
Example • Function f is defined by the equation . • Function g is defined by the graph at right. • Find these values: • f (8) • f (-7) • g (1) • g (-2) • Find x when g (x) =0. To find when g(x)=0, find a place where the y value is zero. That is at (-2,0)
To Be or Not to Be (a Function) g. independent variable: the age of each student in your class dependent variable: the height of each student h. independent variable: an automobile in the state of Kentucky dependent variable: that automobile’s license plate number i. independent variable: the day of the year dependent variable: the time of sunset Below are nine representations of relations.
Identify each relation that is also a function. For each relation that is not a function, explain why not. • For each graph or table that represents a function in parts a–f, find the y-value when x =2, and find the x-value(s) when y =3. Write each answer in function notation using the letter of the subpart as the function name. For example, if graph a represents a function, a(2) =? and a(?)= 3. g. independent variable: the age of each student in your class dependent variable: the height of each student h. independent variable: an automobile in the state of Kentucky dependent variable: that automobile’s license plate number i. independent variable: the day of the year dependent variable: the time of sunset
When you use function notation to refer to a function, you can use any letter you like. • For example, you might use • y=h(x) if the function represents height, or • y=p(x) if the function represents population. • Often in describing real-world situations, you use a letter that makes sense. However, to avoid confusion, you should avoid using the independent variable as the function name, as in y=x(x). Choose freely but choose wisely.
When looking at real-world data, it is often hard to decide whether or not there is a functional relationship. • For example, if you measure the height of every student in your class and the weight of his or her backpack, you may collect a data set in which each student height is paired with only one backpack weight. • But does that mean no two students of the same height could have backpacks of different weights? • Does it mean you shouldn’t try to model the situation with a function?