Download

1 / 40
400 likes | 646 Views
A short introduction to epidemiology Chapter 2a: Conducting a cohort study. Neil Pearce Centre for Public Health Research Massey University Wellington, New Zealand. Chapter 2 (additional material) Cohort studies. This presentation includes additional material on conducting a cohort study

E N D
A short introduction to epidemiologyChapter 2a: Conducting a cohort study Neil Pearce Centre for Public Health Research Massey University Wellington, New Zealand
Chapter 2 (additional material)Cohort studies • This presentation includes additional material on conducting a cohort study • It particularly focuses on occupational studies, because these often have good historical exposure data • Brief mention is also made of other types of cohort studies • More information on data analysis is given in chapter 9
Chapter 2 (additional material)Cohort studies • Defining the cohort • Defining exposure • Follow-up • Data analysis
Birth End of Follow up Death other death lost to follow up “non-diseased” symptoms severe disease
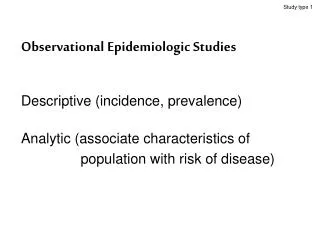
Defining the Cohort • Cohort studies are most frequently conducted in two different contexts: • Studies based on a particular community (e.g. Framingham, birth cohort studies) • Studies based on a particular occupational group (e.g. lung cancer in asbestos workers) • Each type of study may involve an external comparison (e.g. with national mortality rates) or an internal comparison
Defining the Cohort • What is the appropriate comparison population for an external comparison? • What is the most appropriate geographical area? (national, regional, local) • What is the most appropriate population within this area? (all persons, all employed persons, same social class)
The Healthy Worker Effect William Ogle (1885) “Some occupations may repel, while others encourage the unfit at the age of starting work.”
Employed Non-employed
The Healthy Worker Effect • Healthy individuals are more likely to obtain employment • Unhealthy individuals are more likely to leave employment • The health worker effect is particularly strong for heart disease and non-malignant respiratory disease, and is generally weaker for cancer
The Healthy Worker Effect Checkoway et al (1985). Mortality in energy research laboratory workers Cause Observed Expected SMR Cancer 194 250.0 0.78 Heart disease 344 459.9 0.75 Respiratory 42 69.2 0.61 Other 386 540.9 0.71 Total 966 1320.0 0.73
Defining an Occupational Cohort • All workers ever employed in one factory • Workers from multiple plants, engaged in the same industrial process • Members of a trade union or professional organisation • Registered cases of occupational disease (e.g. asbestosis)
Defining an Occupational Cohort Cohort enumeration • Plant personnel records • Union membership listings • Other data sources
Defining an Occupational Cohort Cohort restriction • All employees • Workers first employed on or after a particular date • Gender, ethnicity • Workers with a minimum employment duration (e.g. one month)
Chapter 2 (additional material)Cohort studies • Defining the cohort • Defining exposure • Follow-up • Data analysis
Exposure and dose Exposure: the presence of a substance in the environment external to the worker (external/environmental) Dose: The amount of a substance that reaches susceptible targets in the body (internal)
Measures of exposure Intensity of exposure Duration of exposure Cumulative exposure
Types of exposure data used in occupational studies • Quantified personal measurements • Quantified area- or job-specific data • Ordinally ranked jobs or tasks • Duration of employment in the industry • Ever employed in the industry
Chapter 2 (additional material)Cohort studies • Defining the cohort • Defining exposure • Follow-up • Data analysis
Start of Follow-up Follow-up starts on the first date that each worker satisfies the eligibility criteria for the cohort, I.e. the most recent date of: • Start of employment (plus minimum employment period, e.g. one month) • Date of start of study
Vital Status Deaths ( or e.g. cancer registrations) can be identified through national records For non-deceased participants, vital status can be identified through sources such as: • Employment records • Superannuation records • Electoral rolls • Drivers license records • Postal questionnaire
End of Follow-up Follow-up ends on the last date that each worker satisfies the eligibility criteria for the cohort, I.e. the earliest date of : • Date of death • Date of emigration • Last date known to be alive • Date of finish of study
Employment History of a Worker Year 60 61 62 63 64 65 66 67 Age 27 28 29 30 31 32 33 34(at risk)Employment 1 1 1 1 1 0 0 0status Follow-up 0 1 2 3 4 5 6 7
Chapter 2 (additional material)Cohort studies • Defining the cohort • Defining exposure • Follow-up • Data analysis
Data Analysis • Each worker accumulates person-years of follow-up in categories of age, calendar period (and gender) • These are used to calculate the expected numbers of deaths from all causes and from specific causes • These are then compared to the observed deaths in the cohort
Data Analysis • We wish to compare the death rates in this cohort with those in some standard external comparison population (usually the national population) • This involves calculating the expected number of deaths in the cohort if it had had the same death rate as the comparison population
Strategies of Data Analysis • Overall cohort analysis • assumes that all members of cohort are exposed • cohort can be stratified by duration of employment
Strategies of Data Analysis • Subcohort analysis • job categories • duration of employment within job categories • ordinally ranked job categories • cumulative exposure
Ever Employed in the Industry:SMRs Amongst While Male Phosphate Industry Workers 1949-78 (Checkoway Et Al, 1985) Cause of death Observed Expected SMR All causes1,620 1,623.8 1.00 Lung cancer117 95.9 1.22
Duration of Employment:Lung Cancer Amongst White Male Phosphate Workers 1949-78 (Checkoway Et Al, 1985) Years of work Lung Cancers SMR 1-429 1.36 5-917 1.18 10-1929 1.09 20-2925 1.05 30+17 1.62
Unranked Jobs:Respiratory Disease Mortality in Metal Trades Occupations (Beaumont and Weiss, 1980) Job category Lung Cancers SMR Welders53 1.31 Ship Fitters12 0.57 Burners11 1.57 Boilermakers14 1.98
Ordinally Ranked Jobs:Lung Cancer Amongst Amosite Asbestos Factory Workers (Acheson Et Al, 1984) Exposure Lung Cancers SMR Background11 1.06 Low12 1.34 Medium41 2.25 Heavy8 4.25
Cumulative Exposure:Lung Cancer Amongst Chrysotile Asbestos Textile Workers (Dement Et Al, 1983) Cumulative exposure Lung SMR(fibers/cc x days) Cancers <1,0005 1.33 1,000-9,99910 2.69 10,000-39,9997 3.20 40,000-99,00011 10.00 100,000+2 14.93
A short introduction to epidemiologyChapter 2a: Conducting a cohort study Neil Pearce Centre for Public Health Research Massey University Wellington, New Zealand