Download
1 / 15
150 likes | 448 Views
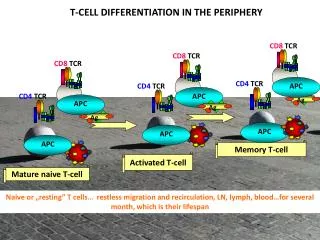
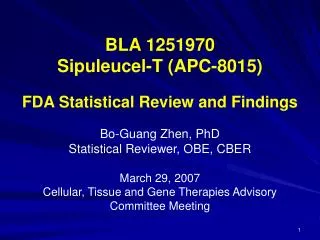
BLA 1251970 Sipuleucel-T (APC-8015) FDA Statistical Review and Findings Bo-Guang Zhen, PhD Statistical Reviewer, OBE, CBER March 29, 2007 Cellular, Tissue and Gene Therapies Advisory Committee Meeting. Outline of Presentation. Review of Efficacy Results Issues in Survival Analysis

E N D
BLA 1251970 Sipuleucel-T (APC-8015) FDA Statistical Review and Findings Bo-Guang Zhen, PhD Statistical Reviewer, OBE, CBER March 29, 2007 Cellular, Tissue and Gene Therapies Advisory Committee Meeting
Outline of Presentation • Review of Efficacy Results • Issues in Survival Analysis • Limitations of Post-Hoc Analysis • Challenges in Survival Analysis
Review of Efficacy Results • Two Phase III studies as main efficacy evidence to support licensing application (Studies 1 and 2) • Both studies failed to • meet the primary endpoint of time to disease progression (TTP) • demonstrate statistical significance for other pre-specified endpoints • Key efficacy evidence was based on the difference in overall survival (OS) between two arms
Review of Overall Survival Analysis * CI = confidence interval, unit for survival is in month
Survival Sensitivity Analysis for Study 1 Covariate Adjustment in Cox model (N=127) * The sponsor’s analysis ~ HR = Hazard ratio
Survival Sensitivity Analysis for Study 1 Covariate Adjustment in Cox model (Cont.) Impact of missing covariate data in Cox Model (I):
Survival Sensitivity Analysis for Study 1 Covariate Adjustment in Cox model (Cont.) • Exclusion of patients due to missing covariate data could lead to biased estimates • Although p-values for treatment effect were greater than 0.05 in a few sensitivity analyses, the majority of the sensitivity analyses resulted in a p-value of <0.05 • Sensitivity analyses supported the “statistically significant finding” for OS
Survival Analysis for Study 2 • p= 0.331 based on log-rank test • Some patients may be excluded in sensitivity analyses using Cox model which could lead to biased estimates • Hypothesis test for treatment effect in Cox model resulted in: o p-values from 0.023 to 0.642 o p > 0.05 in most analyses • Sensitivity analyses did not support the “statistically significant finding” for OS
Review of Overall Survival Analysis--- Sensitivity analyses support the “statistically significant finding” for Study 1
Issues in Survival Analysis • Overall survival (OS) as an endpoint was not defined in either study protocols • A statistical analysis method for the primary comparison in OS was not pre-specified • The alpha level (probability of making a false positive claim for treatment effect) was not allocated to the primary test for OS • The ‘post-hoc’ analyses make it difficult to interpret the hypothesis test results for OS
Limitations of Post-Hoc AnalysisPre-specified vs. post-hoc analysis For designing a confirmative trial, it is essential to: • Define endpoint(s) clearly • Describe statistical analysis method(s) and state which one would be used for the primary comparison • Set alpha level. e.g.: α = 0.05 • Allocate alpha level to each test if multiplicity adjustment is needed -- Then, one is able to say: the difference is statistically significant or not based on the p-value from the primary comparison. Otherwise, it is difficult to interpret the p-value
Hypothetical cases: Interpretation of p-value in studies with pre-specified analysis * NS: non-statistically significant at the level of 0.05
Limitations of Post-Hoc Analysis-- Difficulty in interpreting p-value • Obtaining a p-value of 0.01 (or < 0.05) may not always be considered statistically significant in a well pre-specified analysis. • When a study fails to meet its primary endpoint(s), there is no alpha left for other endpoint analyses. So literally, the difference in other endpoints should not be considered statistically significant. • Therefore, it is difficult to interpret the hypothesis test result for OS in Study 1 (p=0.01)
Limitations of Post-Hoc Analysis • In post-hoc analyses one could o keep conducting hypothesis tests for treatment effect on different endpoints and/or on the same endpoint using different analysis method o then easily obtain a so called “statistically significant result” (p< 0.05) even when there is no treatment effect • If OS is one of the many un-specified endpoints under the testing, it is possible that a p-value of 0.01 was observed just by chance • However, OS is a preferred endpoint for cancer trial
Challenges in Survival Analysis • Difficulty in interpreting the p-value (0.01) • “Statistical significance” only demonstrated in Study 1. • The lower bound of 95% CI for hazard ratio (1.13) close to one