Download
1 / 18
180 likes | 345 Views
Regresión lineal: Ejemplo de juguete. Regresión lineal: Ejemplo de juguete. Regresión lineal: Ejemplo de juguete. Suma de las distancias = -18.2. Regresión lineal: Ejemplo de juguete. Suma de las distancias = -18.2. Área = 2.6569. Regresión lineal: Ejemplo de juguete.

E N D
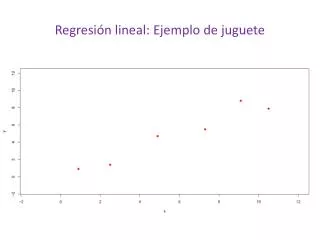
Regresión lineal: Ejemplo de juguete Suma de las distancias = -18.2
Regresión lineal: Ejemplo de juguete Suma de las distancias = -18.2 Área = 2.6569
Regresión lineal: Ejemplo de juguete Suma de las distancias = -18.2
Regresión lineal: Ejemplo de juguete Al final va el script de cómo hacer el anterior en grafico en R
Regresión lineal simple Coeficiente de determinación lineal
Regresión lineal simple Coeficiente de determinación lineal
Regresión lineal simple SUPUESTOS
Código R para el grafico en movimiento setwd(“ruta donde lo queremos guardar") # guarda un archivo gif. saveGIF( { oopt= ani.options(interval = 0.1, nmax =50) nmax = ani.options("nmax") aseq = seq(-3, 3, length = nmax) bseq = seq(0, 4, length = nmax) for (i in 1:nmax) { dev.hold() plot(x, y,ylim=c(-1.5,12),xlim=c(-1.5,12),xlab="x",ylab="y", pch = 19,col=2) abline(aseq[i], b, col = 4) } for (i in nmax:1) { dev.hold() plot(x, y,ylim=c(-1.5,12),xlim=c(-1.5,12),xlab="x",ylab="y", pch = 19,col=2) abline(a, bseq[i], col = 4) } flush.console() ani.pause() } ,movie.name= "regresionpelirapido.gif",outdir = getwd()) library(animation) library(fda.usc) library(pls) library(mgcv) library(MASS) library(fda) library(RCurl) library(bitops) library(Matrix) library(lattice) library(zoo) # posiblementehayalibrerias de mas. ### # Ejemplo de juguete de regresion ## x<-c(0.9,2.5,4.9,7.3,9.1,10.5) y<-c(0.9,1.4,4.7,5.5,8.8,7.9) plot(x, y,ylim=c(-1.5,12),xlim=c(-1.5,12),xlab="x",ylab="y", pch = 19,col=2) fit = coef(lm(y ~ x)) a = fit[1] b = fit[2]