Download
1 / 16
160 likes | 403 Views
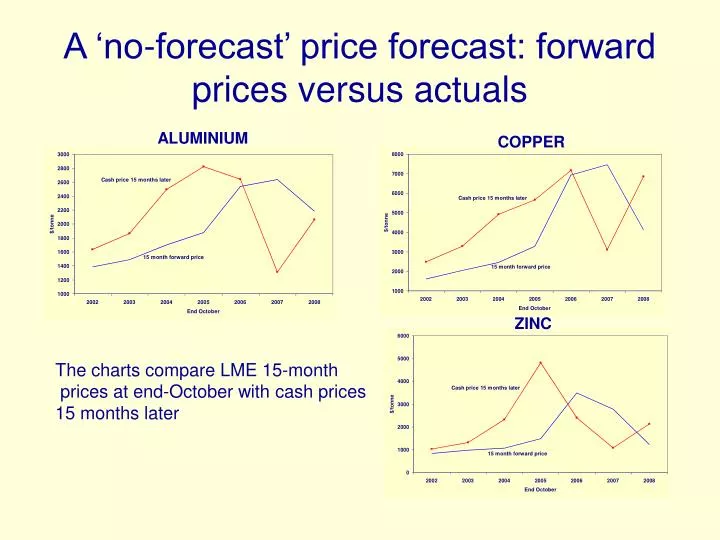
A ‘no-forecast’ price forecast: forward prices versus actuals. ALUMINIUM. COPPER. ZINC. The charts compare LME 15-month prices at end-October with cash prices 15 months later. Analysts’ forecasts of metal prices. ALUMINIUM. COPPER. LEAD. ZINC.

E N D
A ‘no-forecast’ price forecast: forward prices versus actuals ALUMINIUM COPPER ZINC The charts compare LME 15-month prices at end-October with cash prices 15 months later
Analysts’ forecasts of metal prices ALUMINIUM COPPER LEAD ZINC Forecasts by analysts published in the LME Ringsider in October for future years
There are probable world mine reserves of more than 100 Mt of copper, or enough for 80 years at the 1933 rate of consumption. All present knowledge indicates that in spite of the most extensive improvements in technology which can be expected, the second half of this reserve will cost a good deal more to extract than the first half. If consumption should expand at a rate approaching that of 1830 to 1930, there promises to be an acute shortage within a generation. (Skelton, 1934)
Forecasts of copper’s intensity of use Sources: Chase Econometrics’ World Copper Outlook, March 1984. Brook Hunt evidence to the US International Trade Commission, May 1984. WBMS and IMF for actuals.
Refined zinc usage: a 1982 forecast Sources: ILZSG, SRI Metallic Minerals Programme 1982
Refined zinc usage: details Sources: ILZSG, SRI Metallic Minerals Programme 1982
Copper usage, production & capacity Source: ICSG press releases, July 2008 & June 2009
Copper mine %utilisation: 1973-2007 Western world. Sources: RTZ Mine Information System, IWCC, ICSG, WBMS.
Output of Escondida & Grasberg: 1989 to 2007 Source: IWCC Survey of Copper Capacity, March 2008
Output of mines producing both copper and molybdenum Source: Raw Materials Database, Raw Materials Group, Sweden