Download
1 / 46
460 likes | 484 Views
Explore the distribution of beliefs in politics and policy issues and its impact on public policy priorities. Learn about demography, immigration, political socialization, and the decline of trust in government.

E N D
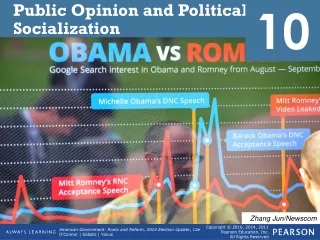
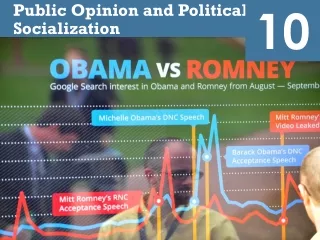
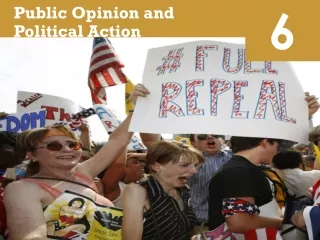
6 Public Opinion and Political Action
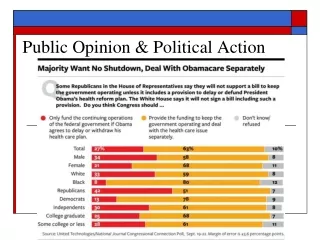
Public Opinion 6 • The distribution of the population’s beliefs about politics and policy issues • It is important for us to understand because this is how we determine public policy priorities
Demography 6.1 • The science of population changes
6.1 NASCAR and Census advertising
Census 6.1 • An “actual enumeration” of the population, which the constitution requires that government conduct every 10 years. The census is a valuable tool for understanding demographic change. • This leads to the distribution of more than $400 billion of federal funding
Census 6.1 • This usually undercounts minorities, low incomes, and children • This leads to those groups receiving less of the federal funding that they deserve
Immigrant Society A nation of nations 1 million legal immigrants/year 500,000 illegal immigrants/year 12% of residents foreign-born Waves of immigration Northwest Europe (English, Irish, Scottish, Germans, Scandinavians) Southern and Eastern Europe (Italians, Jews, Poles, Russians) Hispanics (Cuba, Central America, Mexico) Asians (Vietnam, Korea, Philippines, India) 6.1
Immigrant Society Restrictions on immigration Open door policy Criminals, prostitutes, lunatics, diseased (1875) Chinese Exclusion Act (1882) Johnson-Reid Immigration Act (1924) Hart-Celler Immigration and Nationality Act (1965) Family integration – good or bad idea? 6.1
American Melting Pot Minority majority Hispanic population growing rapidly 6.1
6.1 FIGURE 6.1: The coming minority majority
American Melting Pot Reluctant immigrants 13% of population 26% still live in poverty Political power increasing Simpson-Mazzoli Act (1986) 6.1
6.1 Border fence
American Melting Pot Political culture and assimilation 6.1
Regional Shift Northeast most populous West and South growing since WWII Sun Belt migration Arizona, Texas, Florida Political power of these areas increasing Reapportionment Once each decade, after census 6.1
Graying of America Over-65 fastest growing age group People living longer Fertility rate lower Implications for Social Security Ratio changing Politically-sensitive 6.1
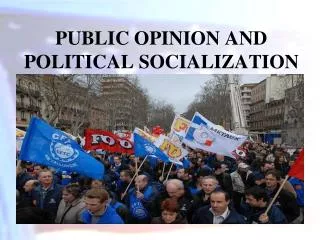
Political Socialization The process through which individuals in a society acquire political attitudes, view, and knowledge, based on inputs from family, schools, the media, and others. It is a subtle process in the US Only a small amount is formal 6.2
Process of Political Socialization Civics class tip of iceberg Family Central role Time and emotional commitment Mass media The new parents (and teachers) Age gap in following politics School Forming civic virtue 6.2
Political Learning over a Lifetime Increasing participation with age Party identification strengthens Political behaviour is learned 6.2
6.2 FIGURE 6.2: Turnout increases with age
Sample 6.3 • A relatively small proportion of people who are chosen a survey so as to be representative of the whole.
Random Sampling The key technique employed by survey researchers, which operates on the principle that everyone should have an equal probability of being selected for the sample. 6.3
Sampling Error The level of confidence in the findings of a public opinion poll. The more people interviewed, the more confident one can be of the results. 6.3
Sampling Error The level of confidence in the findings of a public opinion poll. The more people interviewed, the more confident one can be of the results. 6.3
Random Digit-Dialling A technique used by pollsters to place telephone calls randomly to both listed and unlisted numbers when conducting a survey. 6.3
Roll of Polls in American Democracy Polling as a tool for democracy: pros and cons Gauge opinion between elections Following rather than leading Pandering or shaping? Bandwagon effect Exit polls Affect election results Question wording 6.3
What Polls Reveal About Americans’ Political Information Americans are uninformed Jeffersonian faith in wisdom of common people unfounded Young people most uninformed Who is responsible for the ill-informed electorate? Is it the schools’ fault? Is it the media’s fault? Paradox of mass politics 6.3
6.3 FIGURE 6.3: Many Americans show little knowledge of world geography
Decline of Trust in Government The great slide Vietnam War Watergate Economy/hostage crisis Is public cynicism good? Negative effect on programs for poor 6.3
6.3 FIGURE 6.4: Decline of trust in government, 1958-2012
What Americans Value: Political Ideologies 6.4 • Who Are the Liberals and Conservatives? • Do People Think in Ideological Terms?
6.4 TABLE 6.1: How to tell a liberal from a conservative
Who Are the Liberals and Conservatives? Conservatives dominate 41% conservative/21% liberal Younger people less conservative Minorities less conservative Wealthy more conservative Gender gap Religious more conservative 6.4
Do People Think in Ideological Terms? Types of voters Ideologues Group benefits Nature of the times No issue content Ideology of limited importance Seen as threat to family 6.4
6.4 FIGURE 6.5: Changing attitudes toward gays and lesbians
How Americans Participate in Politics 6.5 • Conventional Participation • Protest as Participation • Class, Inequality, and Participation
Conventional Participation Conventional participation Voting Running for office Collecting signatures for a petition Unconventional participation Protesting Civil disobedience Violence 6.5
Protest as Participation Drawing attention Protests attract the media Rare Civil disobedience Breaking unjust laws 6.5
6.5 Lunch counter sit-in
Protest as Participation Violence 6.5
6.5 Kent State
Class, Inequality, and Participation Higher socio-economic status = higher participation rates Minorities vote at nearly equal levels What are the policy implications of lower political participation? 6.5
Understanding Public Opinion and Political Action 6.6 • Public Attitudes Toward the Scope of Government • Democracy, Public Opinion, and Political Action
Public Attitudes Toward the Scope of Government Should government do more or less? In peacetime, most Americans say “less” But public opinion is complex and inconsistent Ideological conservatives Operational liberals Policy gridlock 6.6
Democracy, Public Opinion, and Political Action Representative democracy Decide who governs Is public fit to choose its leaders? Yes and no 6.6