Download
1 / 1
10 likes | 123 Views
This study quantifies methane emissions in Indianapolis, revealing that urban environments are significant methane sources often underestimated in traditional inventories. Using both aircraft and mobile measurements, researchers identified key contributors to ambient methane levels, such as municipal landfills and natural gas facilities. The findings illuminate the discrepancies in emissions data, emphasizing the need for improved methodologies in greenhouse gas assessments. This research aids in establishing effective policies for mitigating methane emissions in urban areas.

E N D
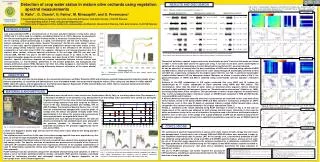
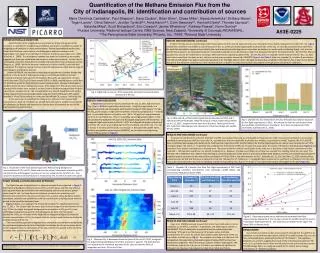
Quantification of the Methane Emission Flux from the City of Indianapolis, IN: identification and contribution of sources Maria Obiminda Cambaliza1, Paul Shepson1, Dana Caulton1, Brian Stirm1, Chase Miller1,Alyssa Hendricks1, Brittany Moser1, Tegan Lavoie1, Olivia Salmon1, Jocelyn Turnbull2,3, Anna Karion3,4, Colm Sweeney3,4, Kenneth Davis5, Thomas Lauvaux5, Natasha Miles5, Scott Richardson5, Eric Crosson6, James Whetstone7, Kuldeep Prasad7, Kevin Gurney8 1Purdue University, 2National Isotope Centre, GNS Science, New Zealand, 3University of Colorado,4NOAA/ESRL, 5The Pennsylvania State University, 6Picarro, Inc., 7NIST, 8Arizona State University A53E-0225 INTRODUCTION and OBJECTIVES Quantification of the magnitude and uncertainties of greenhouse gas (GHG) emissions is important for establishing scientifically sound and cost-effective policies for mitigating such emissions in urban environments. Recent observational studies have shown that cities are major sources of anthropogenic methane emissions with magnitudes much larger than estimated in emission inventories(e.g. Mays et al., 2009, Wunch et al., 2009). The discrepancy between top-down and bottom-up approaches suggests that there are uncharacterized sources in urban environments. For the city of Indianapolis, urban CH4 fluxes do not correlate with emissions from combustion sources (Mays et al., 2009). While the emission inventory for carbon dioxide is relatively well understood, the methane source function is less defined because of the diverse range of anthropogenic and biogenic sources. As part of INFLUX, we have been conducting measurements of carbon dioxide and methane in the air shed of Indianapolis using an aircraft-based platform (Purdue University’s Airborne Laboratory for Atmospheric Research), equipped with a Picarro cavity ring-down CO2/CH4/H2O spectrometer (CRDS), a flask sampling system, and a Best Air Turbulence probe for high-resolution wind measurements. Because Indianapolis is isolated relative to other metropolitan areas, GHG signals from this urban center can be detected with relative ease, making it an ideal location for developing methods for fossil fuel emission measurements. We complemented our aircraft-based data with surface mobile measurements around Indianapolis using our Picarro CRDS and a GPS system installed in a Ford Taurus vehicle to survey and identify the CH4 sources within the city. In this work, we (1) quantified the citywide CH4 emissions from several flight experiments in 2011, (2) combined our aircraft data with surface mobile measurements in Indianapolis to identify and quantify the contributions of important sources to the total citywide CH4 emission flux. RESULTS AND DISCUSSION, continued To determine the sources contributing to the hotspot observed from aircraft measurements, we conducted surface mobile measurements within the city. Figure 4 shows the result from one mobile survey conducted on Jan. 21, 2013specifically targeting the southwest side of the city. On this day, sustained winds were from the west that provided an opportunity to identify the most important contributing sources since their perimeters run north-south on Harding Street. Just as in our aircraft measurements, we intercepted a plume from possible upwind sources by driving on roads that are perpendicular to the wind direction. We find that the two apparent sources are the landfill and a natural gas (NG) transmission regulating station (TRS). For this day and on a separate mobile measurement on Nov. 12, 2012 when winds were from the west, we did not observe any enhancements downwind of BWWTP. Figure 5and Table 1 show the citywide CH4emission fluxes derived from the aircraft-based mass balance approach (equation 1) for five flight dates in 2011. We observe day-to-day variability in the total CH4flux in part due to the fact that one of the important contributors to the citywide emission is landfill microbial activity that is dependent on temperature and moisture conditions. North Natural gas leak Fig. 2. Flight path on July 12, 2011 showing the horizontal transects directly downwind of the city. RESULTS AND DISCUSSION In Figure 3A we show the raw CH4 data from the July 12, 2011 flight transects (Fig. 2) and in 3B the kriged (interpolated) result. Using the kriged winds, and background profile, we calculated a total flux for this day of ~200 moles s-1 for CH4. The CH4 plume shows a range of enhancements relative to background of ~ 10 to 80 ppb. A noticeable feature in the data is the ~60 to ~80 ppb CH4 hotspot between -10 to +2 km at all altitudes. The corresponding upwind geographic region of the city consistently represents the source of the largest component of the total flux. In a separate flight experiment on March 1, 2011, we followed the plume upwind and found the CH4 source area originating from the southwest side of the city. This side of the city is home to potential CH4 sources such as the Southside Landfill (SSLF), Belmont wastewater treatment plant (BWWTP), and a transmission regulating station (TRS) as shown in Figure 2. FLIGHT DESIGN and MASS BALANCE APPROACH The flight plan was designed based on the experimental theory depicted in Figure 1. Wind carrying background concentrations of CO2 and CH4 blows over the city, where it picks up greenhouse gas emissions from anthropogenic sources such as cars, power plants, landfills, etc. By flying horizontal transects normal to the prevailing wind direction downwind of the city, enhancements in CO2 and CH4 above background were intercepted, detected and quantified by the on-board aircraft sampling system from the ground to the top of the boundary layer. Figure 2 shows, as an example, the horizontal transects for a flight experiment on July 12, 2011. The curtain flight transects span distances longer than the diameter of the city (~70 km) to clearly distinguish background concentrations of CO2 and CH4 from anthropogenic greenhouse gas from the Indianapolis air shed. The horizontal distribution of CH4as a function of the height above the ground (Figure 3) shows the elevated concentrations of CH4, the largest of which can be traced back to the Southside landfill southwest of the city. The mass balance approach integrates the incremental concentrations multiplied by the wind speed perpendicular to the flight path to calculate the flux at any point, which is then integrated over the dimensions of the city and from the ground to the top of the boundary layer according to the equation: Fig. 5. Citywide CH4 flux derived from the aircraft-based mass balance approach for five flight experiments in 2011. Also shown are the flux contributions from the Southside landfill (SSLF) on Harding St. Error bars correspond to ± 50% uncertainty (Cambaliza et al., 2013). CH4 Enhancement (ppb) 1 338 675 1012 1349 1686 Fig. 4. Observed CH4 enhancements (ppb) directly downwind of SSLF and a natural gas TRS on Harding St. obtained during a surface mobile measurement on Jan. 21, 2013. Sustained winds were from the west. North points to the left. Note that a NG leak was also observed on Oliver Ave. Bridge just outside the city center. RESULTS AND DISCUSSION continued To isolate the combined CH4emission from SSLF and TRS, we assumed that cells are attributable to these sources if the measured concentration is at least two standard deviations greater than the mean city CH4 concentration, and correlates with back trajectory analysis using measured winds. Together, the SSLF and TRS have a combined percentage contribution to the total flux that ranges from 19% to 59% (Table 1) for the five flight experiments, with a mean contribution of ~37% corresponding to ~45 moles s-1.To partition the combined flux from SSLF and TRS, we measure the areas under the curves of these two distinct plumes (Figure 4) and determine their relative contributions to the total area. We assume that the relative contributions to the total area is the same as the relative contribution to the total SSLF + TRS flux determined from our aircraft measurements. However, the downwind distances of these two sources from Harding Street are not equal. The TRS was ~40 m while SSLF was ~1300 m from Harding St. Since the dispersion of the plume is a function of downwind distance, we thus use a simple Gaussian plume model to apply a correction to the relative flux contribution of TRS at 1300 m, the same distance as SSLF. Using the Jan. 21, 2013 and Nov. 12, 2012 mobile surface measurements, we find that the mean emission flux from the TRS was 20 ± 17 millimoles s-1, a negligible figure relative to the significant contribution from the SSLF. Hence, the observed excess CH4 from aircraft data and the corresponding mean flux of ~45 moles s-1 was essentially entirely attributable to the SSLF(Figure 5). Table 1. Citywide CH4 Emission Flux from five flight experiments in 2011 with corresponding combined contributions from Southside Landfill (SSLF), and Transmission Regulation Station (TRS) Fig. 1. Illustration of the mass balance approach. Wind carrying background concentrations of CO2 and CH4 blows over the city, where it intercepts and picks up GHG emissions from anthropogenic sources such as cars, power plants, land fills, etc. Flux across the downwind crosswind plane is measured by the aircraft as it rasters this plane. Figure 6. Observed propane versus methane enhancement from flask measurements downwind of the city (but outside the landfill plume) for several Indianapolis flight experiments. The solid lines correspond to the upper and lower 95% confidence limits. RESULTS AND DISCUSSION continued Mays et al. (2009) previously showed that mobile fuel combustion is not an important source of CH4emission in Indianapolis, and stated above, neitheris the BWWTP. Thus, to determine the potential source contributing to the remaining ~67%, we show the regression of propane versus methane concentrations(R2 = 0.61) for aircraft flask samples taken downwind of the city but outside the SSLF plume (Fig. 6). We compared the slope with the mean NG composition data reported by Panhandle Eastern Pipeline (PEP) for their four transmission segments. PEP is the primary supplier of NG to Indianapolis. We find that the slope of the C3H8versus CH4data is not statistically significantly different from the mean NG composition data from PEP at the 95% CL. (1) CONCLUSIONS Our aircraft and mobile surface measurements showed that the landfill is an important source contributing to about a third of the total citywide CH4 emission flux, corresponding to a mean contribution of ~45 moles s-1. The regression between C3H8and CH4suggests that much of the remaining emission flux (~90 moles s-1) is primarily derived from the NG transmission and distribution system. This NG leakage flux is an energy equivalent to the electric power energy consumption of ~26,000 households. Fig. 3. Observed CH4in downwind transects (panel A) for July 12, 2011, along with thekriged (interpolated) data from these transects in panel B. The black dashed line represents the southwest boundary of the city such that the limits of integration are from -31 km to +52 km. ACKNOWLEDGEMENT This study is part of the Indianapolis Flux Experiment (INFLUX), which is funded by the National Institute of Standards and Technology.