Download
1 / 14
140 likes | 288 Views
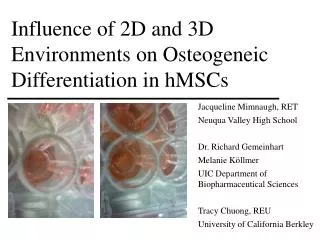
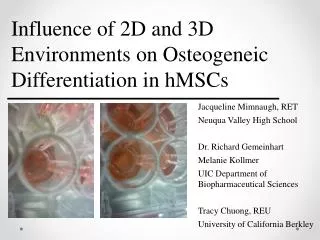
Influence of 2D and 3D Environments on Osteogeneic Differentiation in hMSCs. Jacqueline Mimnaugh , RET Neuqua Valley High School Dr. Richard Gemeinhart Melanie Kollmer UIC Department of Biopharmaceutical Sciences Tracy Chuong , REU University of California Berkley.

E N D
Influence of 2D and 3D Environments on Osteogeneic Differentiation in hMSCs Jacqueline Mimnaugh, RET Neuqua Valley High School Dr. Richard Gemeinhart Melanie Kollmer UIC Department of Biopharmaceutical Sciences Tracy Chuong, REU University of California Berkley
hMSCs and Tissue Engineering Human Mesenchymal Stem Cells (hMSCs) Can differentiate into bone, cartilage, fat, and other cells Tissue Engineering ↓ Bone diseases/defects, trauma, cancer, mal-union/non-union fractures Osteogenesis → Induce hMSCs to develop into bone cells
The Problem Cells in the lab are typically cultured on plates 2 D Cells in vivo (in an organism) 3 D It is possible that cells grown in a 3D scaffold would: • Be more like cells in vivo • Would not reach confluence as quickly • Could be implanted directly
Research Project How will a 2D and 3D environment effect the osteogenic differentiation of hMSCs? Compare cells grown in a 2D and a 3D environment: • Viability? • Proteins? • Genes expressed? • Mineralization?
Creating a 3d Scaffold Superporous Hydrogels • Poly (ethylene glycol) diacrylate or PEGDA • Polymer network, hydrophilic • Pores from 100 µm to 600 µm created by gel-foaming
Project Overview 1. Seed hMSCs onto 2D plates and 3D hydrogels After 24 hours 2. Add osteogenic differentiation medium After 24 hours 3. Compare cells at day 2, 7, 14, 21 and 28
Comparing the cells 1. MTS – Cell Viability 2. BCA – Protein Levels 3. Calcium 4. Alkaline Phosphatase – Early Marker 5. ELISA: Osteopontin – Early and Late Marker Osteocalcin – Late Marker 6. qPCR – Determine Gene Expression - ALPL, RUNX2, OC, OP, BMP2 7. Von Kossa Staining - Mineralization
MTS Results Cell Viability/Proliferation – Cells breakdown MTS into a product that can be detected by a spectrophotometer higher absorbance = more viable cells
MTS Results But wait a minute! These results are misleading… • Literature: 3000 cells/cm2 • 2D wells: 0.75 cm2 → 2250 cells • 3D gels: 150 cm2→ 450,000 cells
ALP Results Alkaline Phosphatase – ALP is a byproduct of osteoblast activity. ALP cleaves a substrate to product a fluorescent product higher fluorescence = more ALP activity
Von Kossa Results Von Kossa stain binds to phosphate and calcium in the sample More dark spots = more mineralization 2D Plate, 40 X 3D Plate, 40X Day 7
Von Kossa Results Von Kossa stain binds to phosphate and calcium in the sample More dark spots = more mineralization 2D Plate, 40 X 3D Plate, 40X Day 14
Von Kossa Results Day 7 Day 14 2D Plate, 40 X 3D Plate, 40 X
Considerations • Standard deviation for SPH samples – H 39 vs. Smoker 2. Create a standard curve for MTS to determine actual number of cells?