Download
1 / 14
140 likes | 296 Views
Education investment and commitment: reassessing the international benchmarks. Albert Motivans UNESCO Institute for Statistics IWGE 2010, Stockholm 7 June 2010. UIS and global education finance data. The UNESCO Institute for Statistics: Collects national domestic finance data annually

E N D
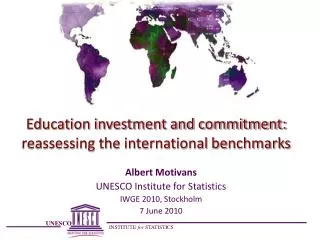
Education investment and commitment: reassessing the international benchmarks Albert Motivans UNESCO Institute for Statistics IWGE 2010, Stockholm 7 June 2010
UIS and global education finance data The UNESCO Institute for Statistics: • Collects national domestic finance data annually • Disseminates data three times a year on the UIS Data Centre which is revised retrospectively based on new GDP estimates • Uses and interprets data • Impact of financial crisis on education budgets (2009) • Financing education in Africa (with Pole de Dakar and IIEP in 2010) • Provides technical assistance/data quality diagnoses • Sustainable reporting of financing data in sub-Saharan Africa (sector review follow-up) • Data quality assessment framework (DQAF)
The global distribution of education spending, 2007 Public education expenditure (billion PPP$) Source: UNESCO Institute for Statistics, 2010
The investment to educate a child One year of primary school, PPP$ Source: UNESCO Institute for Statistics, 2010
Risks in benchmarking public education spending • Crude measures of macro-level inputs • Missing a big part of the picture where household contributions are not counted • Likewise miss the contributions from local and regional governments • Relying only on relative measures one can lose sight of absolute needs • Missing the underlying story of the conditions that influence spending/costs
Accounting for national contexts • Overall proportion of and growth rates of the school age population • Coverage of the education system • even by single grades! • The roles of government and societies • Redistributive or direct channel for families • Volume of education provision • years of primary schooling, hours of instruction • Quality of education provision • teaching standards, teaching/learning environment • Efficiency of education provision • repetition, retention and completion
Group A Group B Group C Different levels of capacity and demand imply different resource needs
The traditional benchmarks • Investment/cost • Per pupil public expenditure (PPP$) • Per pupil public expenditure as a share of GDP per capita • Effort/commitment • Public education expenditure as a share of national income (GDP) or per capita • Public education expenditure as a share of government budget (TGE) • Share of education expenditure by source of funds
Investment/cost • Per pupil expenditure is calculated as the annual expenditure (recurrent or total) divided by the number of pupils • Countries range from 2% to 25% and less than PPP$100 to more than PPP$15,000 • Often presented as ‘unit costs’ but only represents part of total costs; better described as public investment per pupil • Two complementary measures • Relative (as a % of GDP per capita) allows cross-national comparisons • Absolute measures (in PPP$) allow assessment of its sufficiency
Relative and absolute measures of per primary pupil public expenditure in SS Africa, 2008 Source: UNESCO Institute for Statistics, 2010
Effort/commitment, I • The share of national income (GDP) invested in education – often interpreted as a measure of commitment to education • Countries range from less than 1% to 15% • Often misapplied, e.g., ‘5-6% of GDP should be spent on education’ cited (based on OECD) • Not always a good measure of government ‘effort’ because of differences in duration of schooling, coverage of education and other national contexts
Effort/commitment, II • The share of public expenditure invested in education – also interpreted as a measure of commitment to education • Countries range from less than 10% to 30% • Closer to commitment in that it represents the actual government budget constraints • Level highly dependent upon the role of governments and societies; whether governments play a redistributive role or families and communities are more directly responsible for the education of their children
Comparing national ‘effort’ fromthe perspective of fiscal space Higher share of public spending Higher share of education spending
Developing the measurement agenda • Improve relevance of benchmark measures • Explore grade or school-year based measures of investments/costs • Capture the full picture of investments/costs • Improve comparative frameworks for measuring household contributions to education • Reach consensus on what represents an education cost in different societies/economies • Data/indicators that are needed to address emerging issues...open for discussion