Download
1 / 24
240 likes | 371 Views
National Health Spending in 2012: Rate of Health Spending Growth Remained Low for the Fourth Straight Year. Anne Martin Micah Hartman Lekha Whittle Aaron Catlin and The National Health Expenditure Accounts Team. 2012 National Health Expenditure Accounts.

E N D
National Health Spending in 2012: Rate of Health Spending Growth Remained Low for the Fourth Straight Year Anne Martin Micah Hartman Lekha Whittle Aaron Catlin and The National Health Expenditure Accounts Team
2012 National Health Expenditure Accounts National health spending increased 3.7 percent in 2012 following 3.6 percent growth in 2011. National health spending reached $2.8 trillion, or $8,915 per person in 2012. The share of Gross Domestic Product (GDP) devoted to health care spending fell slightly—from *17.3 percent in 2011 to 17.2 percent in 2012. *The 2011 health share of GDP was revised due to a large upward revision to GDP SOURCE: Centers for Medicare & Medicaid Services, Office of the Actuary, National Health Statistics Group.
Growth in National Health Expenditures (NHE) and Gross Domestic Product (GDP), and NHE as a Share of GDP, 1990-2012 March 2001- November 2001 Recession July 1990- March 1991 Recession December 2007- June 2009 Recession Percent Calendar Years SOURCES: Centers for Medicare and Medicaid Services, Office of the Actuary, National Health Statistics Group; Department of Commerce, Bureau of Economic Analysis and National Bureau of Economic Research.
2012 National Health Expenditure Accounts Overall Mixed Trends Faster growth in personal health care (PHC) spending Slower growth in investment and the net cost of private health insurance; decline in non-commercial research SOURCE: Centers for Medicare & Medicaid Services, Office of the Actuary, National Health Statistics Group.
2012 National Health Expenditure Accounts Price vs. Non-Price Trends Price growth accounted for a smaller portion of health spending increase in 2012 compared to 2011. Non-price factors accounted for a larger portion of health spending increase in 2012 compared to 2011. Population growth Age & gender shifts Other, such as use & intensity of health care goods and services SOURCE: Centers for Medicare & Medicaid Services, Office of the Actuary, National Health Statistics Group.
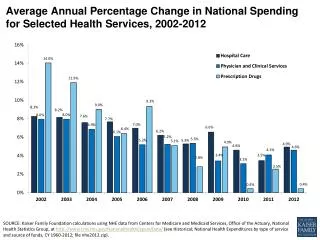
2012 National Health Expenditure Accounts Trends by Services in 2012 Spending increased at a faster rate: Hospital care Physician and clinical services Spending increased at a slower rate: Retail prescription drugs Nursing care facilities SOURCE: Centers for Medicare & Medicaid Services, Office of the Actuary, National Health Statistics Group.
2012 National Health Expenditure Accounts Trends by Payers in 2012 Spending increased at a faster rate: Medicaid Out-of-pocket spending Spending increased at a slower rate: Private health insurance Medicare SOURCE: Centers for Medicare & Medicaid Services, Office of the Actuary, National Health Statistics Group.
Affordable Care Act Overall, Affordable Care Act provisions effective for 2010 through 2012 had minimal impact on total national health spending. Sector-specific provisions: Private health insurance Pre-existing condition insurance program Early retiree reinsurance program Coverage for dependents under age 26 Minimum medical loss ratio Medicare Program Reduced payment updates (productivity adjustments) Retail Prescription Drugs Medicare drug coverage gap discount program Medicaid retail prescription drug rebates SOURCE: Centers for Medicare & Medicaid Services, Office of the Actuary, National Health Statistics Group.
The Nation’s Health Dollar ($2.8 Trillion), Calendar Year 2012: Where It Went 1 Includes Research (2%) and Structures and Equipment (4%). 2Includes Durable (1%) and Non-durable (2%) goods. 3 Includes expenditures for residential care facilities, ambulance providers, medical care delivered in non-traditional settings (such as community centers, senior citizens centers, schools, and military field stations), and expenditures for Home and Community-based Waiver programs under Medicaid. Note: Sum of pieces may not equal 100% due to rounding. SOURCE: Centers for Medicare & Medicaid Services, Office of the Actuary, National Health Statistics Group. 10
Annual Growth in Spending by Type of Service, 2011 and 2012 SOURCE: Centers for Medicare & Medicaid Services, Office of the Actuary, National Health Statistics Group.
Annual Growthin Hospital Spending, 2008 - 2012 Total spending=$882.3 billion Spending increased 4.9% Faster growth in 2012 driven by: Private Health Insurance Medicare Medicaid SOURCE: Centers for Medicare & Medicaid Services, Office of the Actuary, National Health Statistics Group.
Annual Growth in Physician and Clinical Services Spending, 2008 - 2012 • Total spending=$565.0 billion • Spending increased 4.6% • Faster growth in 2012 driven by: • Use & intensity of services • Out-of-pocket spending • Private Health Insurance SOURCE: Centers for Medicare & Medicaid Services, Office of the Actuary, National Health Statistics Group. 13
Annual Growth in Retail Prescription Drug Spending, 2008- 2012 • Total spending=$263.3 billion • Spending increased 0.4% • Slower growth in 2012 driven by: • Slow growth in prices • Patent expirations • Increased Generic Dispensing Rate • Decline in out-of-pocket spending • Decline in Private Health Insurance spending SOURCE: Centers for Medicare & Medicaid Services, Office of the Actuary, National Health Statistics Group. 14
The Nation’s Health Dollar ($2.8 trillion), Calendar Year 2012: Where It Came From 1 Includes worksite health care, other private revenues, Indian Health Service, workers’ compensation, general assistance, maternal and child health, vocational rehabilitation, Substance Abuse and Mental Health Services Administration, school health, and other federal and state local programs. 2Includes co-payments, deductibles, and any amounts not covered by health insurance. Note: Sum of pieces may not equal 100% due to rounding. SOURCE: Centers for Medicare & Medicaid Services, Office of the Actuary, National Health Statistics Group. 15
Annual Growth in Spending by Source of Funds, 2011 and 2012 SOURCE: Centers for Medicare & Medicaid Services, Office of the Actuary, National Health Statistics Group.
Private Health Insurance: Growth in Enrollment, Premiums, and Benefits, 2008 – 2012 • Total Spending = $917.0 billion • Spending increased 3.2% • Enrollment reached 188 million • Slightly slower premium growth in 2012 driven by: • Increased enrollment in high-deductible plans • Lower growth in the net cost of insurance SOURCE: Centers for Medicare & Medicaid Services, Office of the Actuary, National Health Statistics Group. 17
Private Health Insurance: Growth in Per Enrollee, Premiums, and Benefits, 2008 – 2012 • Premium and medical benefit per enrollee trend remained low • Relatively flat premium per enrollee trend • Medical benefit spending per enrollee trend: • Slightly faster due to an acceleration in spending for hospital care and physician and clinical services • Partially offset by a decline in retail prescription drug spending SOURCE: Centers for Medicare & Medicaid Services, Office of the Actuary, National Health Statistics Group. 18
Medicare: Growth in Total Expenditures and Enrollment, 2008 – 2012 • Total Spending = $572.5 billion • Spending increased 4.8% • Slightly slower growth in 2012 was driven primarily by a decline in Nursing Home Care spending SOURCE: Centers for Medicare & Medicaid Services, Office of the Actuary, National Health Statistics Group. 19
Medicare: Growth in FFS and Medicare Advantage Expenditures and Enrollment, 2008 – 2012 SOURCE: Centers for Medicare & Medicaid Services, Office of the Actuary, National Health Statistics Group. 20
Medicaid: Growth in Total Expenditures and Enrollment, 2008 – 2012 • Total Spending = $421.2 billion • Spending increased 3.3% • Slightly faster growth in 2012 driven by increased spending growth for: • Hospital care • Other health, residential, and personal care • Spending growth in 2011 and 2012 historically low (excluding 2006) due to: • Slowdown in enrollment growth • States efforts to control costs SOURCE: Centers for Medicare & Medicaid Services, Office of the Actuary, National Health Statistics Group.
Medicaid: Growth in Total, Federal, and State & Local Expenditures, 2008 – 2012 SOURCE: Centers for Medicare & Medicaid Services, Office of the Actuary, National Health Statistics Group.
Distribution and Annual Growth by Type of Sponsor Note: Sum of pieces may not equal 100% due to rounding. SOURCE: Centers for Medicare & Medicaid Services, Office of the Actuary, National Health Statistics Group. 23
2012 National Health Expenditure Accounts:Summary • National Health Expenditures increased 3.7 percent in 2012. • National Health Expenditures reached $2.8 trillion, or $8,915 per person in 2012. • National Health Expenditures represented a 17.2 percent share of Gross Domestic Product (GDP). • Spending grew faster in 2012 for: • Hospitals • Physician and clinical services • Medicaid • Out-of-pocket • Spending grew at a slower rate in 2012 for: • Prescription drugs • Nursing care facilities • Private health insurance • Medicare • Sponsor • Shares have remained stable except for the end of the temporary shift from federal to state and local SOURCE: Centers for Medicare & Medicaid Services, Office of the Actuary, National Health Statistics Group. 24