GROWTH-SHARE POSITIONING
160 likes | 335 Views
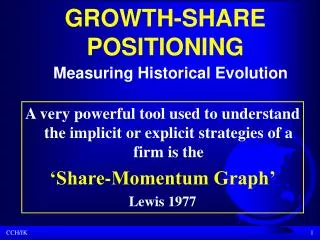
GROWTH-SHARE POSITIONING. Measuring Historical Evolution. A very powerful tool used to understand the implicit or explicit strategies of a firm is the ‘Share-Momentum Graph’ Lewis 1977. Example of a share-momentum graph. LOSING SHARE. HOLDING SHARE. Historical Market Growth

GROWTH-SHARE POSITIONING
E N D
Presentation Transcript
GROWTH-SHARE POSITIONING Measuring Historical Evolution A very powerful tool used to understand the implicit or explicit strategies of a firm is the ‘Share-Momentum Graph’ Lewis 1977
Example of a share-momentum graph LOSING SHARE HOLDING SHARE Historical Market Growth (Five-year Period) C E D B A GAINING SHARE Historical Growth of Business Sales (Five-year Period)
Construction of the Graph • Pick a relevant time-frame • Plot the position of each business unit in terms of two dimensions: the total market growth for that period and the growth rate of sales for the same period (defined in either nominal or real terms) • The area within the circles represents each business unit as a proportion of total sales for the last year of the chosen period.
Positioning • Businesses that have grown at the same rate as the industry have held their market share, fall on the diagonal line • Below the diagonal line are businesses that have increased sales at a rate higher than their markets (increased their market share) • Falling above the diagonal, are businesses that decreased their share of the market
CHALLENGING THE BASIC PREMISES OF THE BCG APPROACH Marakon, a management consulting company, has presented a theoretically better grounded approach to strategic investment planning which challenges the growth-share approach.
Marakon’s views can be summarised as follows: • Growth and profitability are not generally tightly linked. In fact they tend to compete or trade-off. • Good planning should not call for passing up profitable investment opportunities • Ideal business portfolios are not necessarily balanced in terms of internal cashflows.
The Trade-off between Profitability and Growth Decreasing Share Strategy Holding Share Strategy Increasing Share Strategy Business ROI Business Cost of Capital Market Growth Business Growth
Business-unit Cost of Capital(Horizontal cut-off line) • Any investment option that falls above the line implies an attractive investment opportunity
Market Growth Rate(Vertical cut-off line) • A strategy that falls on that line corresponds to a holding market share strategy • One to the left of the line implies a decreasing market-share strategy • One to the right of the line implies an increasing market-share strategy.
Additivity Principle Every investment opportunity should be judged on its own merits and should be accepted or rejected depending on whether its projected ROI falls above or below the cost of capital associated with that investment opportunity. In other words, there are no magic financial synergism. The value of the firm is simply equal to the sum of the values of its components.
Cash Generation and Cash Using characteristics of a Business in terms of its Growth and Profitability Cash Generators Cash Neutral A Business ROE D Firm Cost of Capital C E B Growth of Firm Assets Cash Users Growth Business Assets
Implications of Cash Generation and Cash Use • Vertical axis corresponds to the ROE earned by a given business • Horizontal axis represent the corresponding business assets growth • A business placed in the diagonal is growing at the same rate as its ROE, and neither generates cash nor requires cash from the firm; it is a cash-neutral. • Businesses above the diagonal are cash generators • Those below the diagonal are cash consumers.
Earnings Generated To understand this line of reasoning, consider that the total equity investment in the business is E and the earnings generated are p. By the definition of return on equity (ROE) we can state that p = E x ROE
Business Growth If we apply all earnings to the same business in order to tap new investment opportunities, the business growth as measured by the growth of the total investment is p G = E
An Excellent portfolio which is not cash-balanced B C Business ROE CASH GENERATORS A D Firm Cost of Capital CASH USERS Growth of Firm Assets Growth of Business Assets
A Balanced Portfolio which is not necessarily profitable CASH GENERATORS Business ROE Firm Cost of Capital A C D B CASH USERS Growth of Firm Assets Growth of Business Assets