Download
1 / 11
110 likes | 126 Views
This course explores the design and development of graphical user interfaces using MATLAB. Topics include advanced GUI features, position and set properties with GUIDE, and functionality of GUI controls such as sliders, push buttons, and radio buttons. Other topics covered include file open/save dialogs, button down functions, and scientific visualization using MATLAB.

E N D
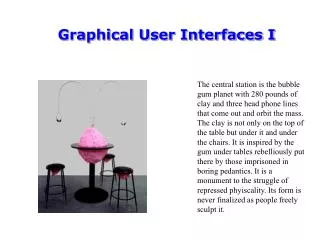
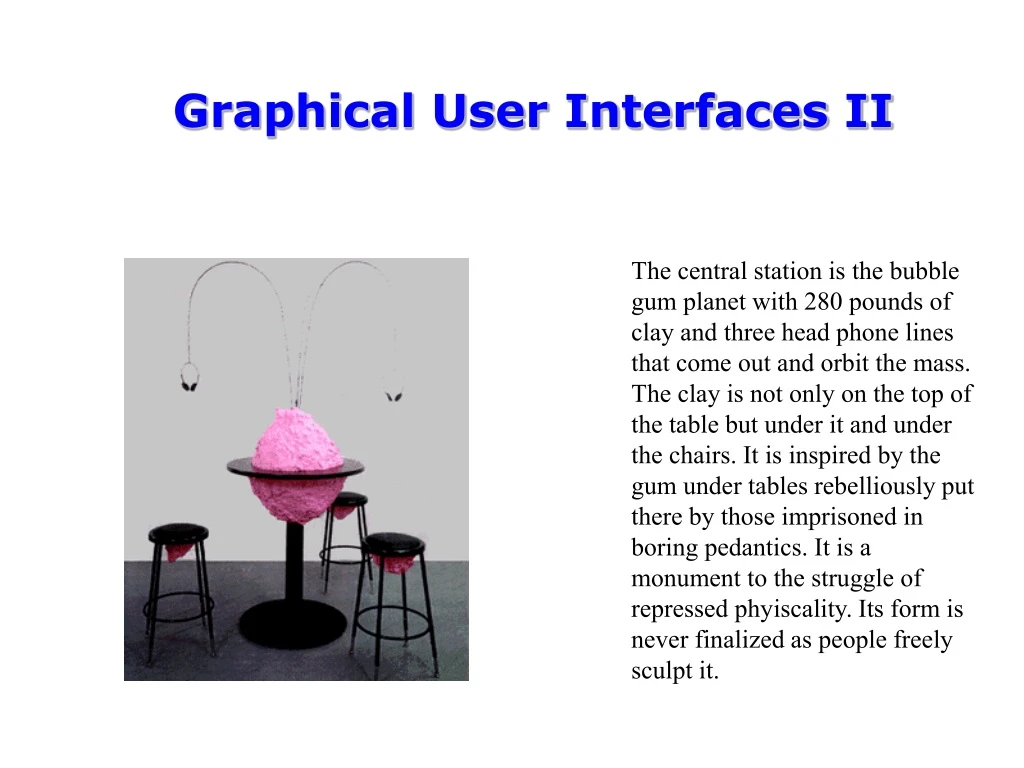
Graphical User Interfaces II The central station is the bubble gum planet with 280 pounds of clay and three head phone lines that come out and orbit the mass. The clay is not only on the top of the table but under it and under the chairs. It is inspired by the gum under tables rebelliously put there by those imprisoned in boring pedantics. It is a monument to the struggle of repressed phyiscality. Its form is never finalized as people freely sculpt it.
Outline Announcements HW IV due a week from Friday Either GUI or Volume Viz or Choose-your-own Summary of Friday Programming converttemp.m Advanced GUI features Homework III Course Evaluations
When we last saw our heros… GUI’s are made of UIcontrols of various ilks (slider, push buttons, radio buttons etc.) Position the controls and set properties with GUIDE ‘callback’ field is a function call that gets executed when the control is activated
Example: converttemp.m We’ve set the positions, lets set some data: Set sliders’ min & max values +/- 50°C Set sliders’ values=0°C Set edits’ strings=num2str(value) Set Celsius button to on (value=1) and others to off (0) Set Kelvin and Fahrenheit sliders’ visibility to off Set figures userdata to handle matrix h= radio1,radio2,radio3 edit1, edit2, edit3 slide1, slide2, slide3
Functionality of converttemp Top-down design is critical to GUI development Figure out the big picture first, then the details: 1. Sketch layout of objects 2. Create layout with GUIDE 3. Describe what should happen when buttons are pressed, sliders slid in English or pseudocode 4. Add functionality gradually--simple things first
Functionality of converttemp 3. Describe what should happen when buttons pressed, sliders slid Radio Buttons: (Tradio.m) 1. turn corresponding slider on, others off Edits: (Tedit.m) 1. convert string to number & adjust corresponding slider’s value 2. convert value to other units and update their edits & sliders Sliders: (Tslider.m) 1. convert value to string & adjust corresponding edit’s string 2. convert value to other units and update their edits & sliders Tconvert.m-- handles 2.
Miscellaneous & Advanced GUI features File Open/Save dialogs– uigetfile & uisavefile can place these calls in any function especially common inside callback of GUI button Common GUI features: There are 18 fields that all Matlab objects have (things like position, type, and tag) ButtonDownFnc allows objects to respond to user
Button Down Functions ButtonDownFnc acts like a callback--it contains a function call that is executed when user clicks on object Could make stop sign turn green when clicked Get the z=f(x,y) of a patch where the user clicked (x,y): function zlookup ax=get(gcbo,’parent’); %axes of object xy=get(ax,’CurrentPoint’); <get x, y, Z, from patch’s userdata> z=interp2(x,y,Z,xy(1),xy(2)); <send results to appropriate place>
Other Scientific Visualization Courses This is the only course to focus on scientific visualization, especially using Matlab. If you are interested in computer graphics: CS 417: Computer Graphics and Visualization (lear OpenGL, make $$$) If you are interested in making effective visualizations: try the Communications Department which offers courses on visual communication, human-computer interaction, and scientific writing
Other Scientific Computing Courses CIS Tools Curriculum Fall: MATLAB 401: the basics 402: visualization Spring: General tools 403: Developing scientific computer programs (compilers, debuggers, managing large projects) 404: Numerical libraries 403 begins Feb. 18 404 begins March 25 (after spring break)
Evaluations Please give me as much data as you can specific lecture/topics you liked & those you didn’t other topics to cover? Tools Curriculum & mini-course format? Thanks!