Download
1 / 48
580 likes | 948 Views
Life-Cycle Analysis Results of Vehicle/Fuel Systems with the GREET Model. Michael Wang Center for Transportation Research Argonne National Laboratory The Energy Modeling Forum on Climate Change Impacts and Integrated Assessment Snowmass, CO, August 3, 2006.

E N D
Life-Cycle Analysis Results of Vehicle/Fuel Systems with the GREET Model Michael Wang Center for Transportation Research Argonne National Laboratory The Energy Modeling Forum on Climate Change Impacts and Integrated Assessment Snowmass, CO, August 3, 2006
Life-Cycle Analysis for Vehicle/Fuel Systems Has Been Evolved in the Past 20 Years • Historically, evaluation of vehicle/fuel systems from wells to wheels (WTW) was called fuel-cycle analysis • Pioneer transportation WTW analyses began in 1980s • Early studies were motivated primarily by battery-powered EVs • Recent studies are motivated primarily by introduction of new fuels such as hydrogen and biofuels • For transportation technologies, especially internal combustion engine technologies, the significant energy and emissions effects occur in • The fuel usage stage • The fuel production stage
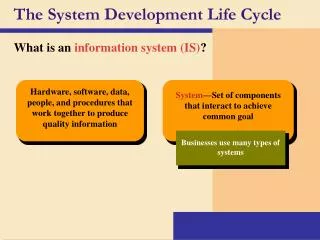
Life-Cycle Analysis of Vehicle/Fuel Systems Covers Both Fuel Cycle and Vehicle Cycle Vehicle Cycle (GREET 2 Series) Fuel Cycle (Well-to-Wheels) (GREET 1 Series) Pump to Wheels Well to Pump
WTW Analysis Is a Complete Energy/Emissions Comparison As an example, greenhouse gases are illustrated here
The GREET (Greenhouse gases, Regulated Emissions, and Energy use in Transportation) Model • Includes emissions of greenhouse gases • CO2, CH4, and N2O • VOC, CO, and NOx as optional GHGs • Estimates emissions of five criteria pollutants • Total and urban separately • VOC, CO, NOx, SOx,andPM10 • Separates energy use into • All energy sources • Fossil fuels (petroleum, natural gas, and coal) • Petroleum • The GREET model and its documents are available at Argonne’s website at http://greet.anl.gov • There are more than 3,000 registered GREET users worldwide
Calculation Logic for a GivenWTP Production Activity in GREET
Calculation Logic for a Given WTP Transportation Activity in GREET
Gasoline Diesel LPG Naphtha Residual oil Corn Ethanol Petroleum: Conventional Oil Sands Soybeans Biodiesel CNG LNG LPG Methanol Dimethyl Ether FT Diesel and Naphtha Hydrogen Ethanol Hydrogen Methanol Dimethyl Ether FT Diesel and Naphtha Cellulosic Biomass: Switchgrass Fast growing trees Crop residues Natural Gas: NA Non-NA Residual Oil Coal Natural Gas Nuclear Biomass Other Renewables Nuclear Energy Hydrogen Electricity Hydrogen FT Diesel Methanol Coal GREET Includes More Than 90 Fuel Production Pathways from Various Energy Feedstocks
GREET Does Not Includes the Following Fuel Pathways Yet • Petroleum pathways • Venezuelan heavy, sour crude • U.S. oil shale • Bio-fuel pathways • Sugarcane to ethanol • Sugar beets to ethanol • Municipal solid waste to ethanol • Pyrolysis oil from biomass • Biobutanol from sugars • Hydrogen pathways • Metal hydride hydrogen storage • Chemical hydrogen storage • Tube trailer hydrogen transportation • Biological hydrogen production
GREET Includes More Than 75 Vehicle/Fuel Systems Conventional Spark-Ignition Vehicles • Conventional gasoline, federal reformulated gasoline, California reformulated gasoline • Compressed natural gas, liquefied natural gas, and liquefied petroleum gas • Gaseous and liquid hydrogen • Methanol and ethanol Compression-Ignition Direct-Injection Hybrid Electric Vehicles: Grid-Independent and Connected • Conventional diesel, low sulfur diesel, dimethyl ether, Fischer-Tropsch diesel, and biodiesel Battery-Powered Electric Vehicles • U.S. generation mix • California generation mix • Northeast U.S. generation mix Spark-Ignition Hybrid Electric Vehicles: Grid-Independent and Connected • Conventional gasoline, federal reformulated gasoline, California reformulated gasoline • Compressed natural gas, liquefied natural gas, and liquefied petroleum gas • Gaseous and liquid hydrogen • Methanol and ethanol Fuel Cell Vehicles • Gaseous hydrogen, liquid hydrogen, methanol, federal reformulated gasoline, California reformulated gasoline, low sulfur diesel, ethanol, compressed natural gas, liquefied natural gas, liquefied petroleum gas, and naphtha Compression-Ignition Direct-Injection Vehicles • Conventional diesel, low sulfur diesel, dimethyl ether, Fischer-Tropsch diesel, and biodiesel Spark-Ignition Direct-Injection Vehicles • Conventional gasoline, federal reformulated gasoline, and California reformulated gasoline • Methanol and ethanol
WTW Results Are Affected by These Key Assumptions • WTP assumptions • Energy efficiencies of fuel production activities • GHG emissions of fuel production activities • Emission factors of fuel combustion technologies • PTW assumptions • Fuel economy of vehicle technologies • Tailpipe emissions of vehicle technologies • Large uncertainties exist in key assumptions • GREET is designed to conduct stochastic simulations • Distribution functions are developed for key assumptions in GREET
GREET Is Designed With Stochastic Simulations to Address Uncertainties Distribution-Based Inputs Generate Distribution-Based Outputs
Petroleum Refining Is the Key Energy Conversion Step for Gasoline and Diesel
Key Issues for WTW Analysis of Petroleum Fuels • Recovery and refining of unconventional crudes are more energy and emission intensive • Canadian oil sands • Venezuelan heavy, sour crude • US shale oil • Better quality for fuel products is demanded in the U.S. • Gasoline sulfur content of 30 ppm or less • On-road diesel sulfur content of 15 ppm or less • Ethanol is replacing MTBE as a gasoline additive • Energy and emission differences between ethanol and MTBE • Production of gasoline blend stock for ethanol vs. MTBE • LP simulations of petroleum refining indicate that lowered sulfur contents in gasoline and diesel have minimal effects on energy and emissions • But, use of unconventional crudes could significantly deteriorate energy and emissions of gasoline and diesel
ANL Analyzed Energy and GHG Emissions of Recovering and Upgrading Oil Sands North America Has Relatively Little Conventional Oil But 30% of Unconventional Oil Reserves Larsen, Wang, et al., 2005, “Might Canadian Oil Sands Promote Hydrogen Production for Transportation? Greenhouse Gas Emission Implications of Oil Sands Recovery and Upgrading,” World Resource Review, Vol. 17: 220-242.
The Pathway of Oil Sands to Gasoline and Diesel Requires A Large Amount of Steam and H2
WTP GHG Results Show That Oil Sands Pathways Are Carbon-Intensive
NG to FT Diesel Production Is Subject to Large Efficiency Losses
Carbon Emissions Could Be a Major Concern for Coal to FT Diesel • If coal-to-liquid (CTL) plant has an energy efficiency of 52%, CTL WTW CO2 emissions will be two times as much as those of petroleum diesel • With carbon capture and storage, CTL WTW CO2 emissions will be about the same as those of petroleum diesel • If CTL plant has an energy efficiency of 42%, CTL WTW CO2 emissions will be 2.3 times as much as those of petroleum diesel • Integrated design of CTL plants to produce fuels and power will help improve plant efficiency
Biomass to FT Diesel Production Could Result in Multiple Products
GHG Reductions by FT Diesel from Three Feedstocks (XTLs) • GHG is one of the criteria to compare XTLs • Feedstock resource availability and costs are important to consider as well
Production and Compression Are Key Steps for Gaseous H2 Production G.H2: gaseous H2 LNG: liquefied natural gas NA: North American nNA: non-North American NG: natural gas
Resource and Infrastructure IssuesResult in Many Potential H2 Pathways • Key stages affect H2 WTW results • H2 production • H2 compression for gaseous H2 • H2 liquefaction for liquid H2 • Produced from natural gas via steam methane reforming (SMR) now, and in the foreseeable future • Over 90% H2 is currently produced in this way worldwide • Carbon emissions from H2 production plants • Central or station SMR production • Could reduce or avoid expensive distribution infrastructure • But production emissions move close to urban areas • Some amount of central SMR CO2 emissions can be potentially sequestered • Energy and emission effects of electrolysis H2 depend on electricity sources • Fossil fuel-based electricity has huge amount of CO2 emissions for H2 production • Renewable electricity, such as hydro, wind, and solar, has zero CO2 emissions • Gasification for H2 production • Coal: CO2 and criteria pollutant emissions, but CO2 can be potentially sequestered • Biomass: criteria pollutant emissions • Nuclear H2 has zero air emissions, but nuclear waste will continue to be an issue
U.S., Brazil and China Are Major Ethanol Consuming Countries • U.S. • Corn ethanol • No.1 consuming country with 4.2 billion gallons in 2005 • Brazil • Sugarcane ethanol • No.2 consuming country with ~4 billion gallons in 2005 • China • Corn ethanol • No.3 consuming country with ~340 million gallons in 2005
Ethanol WTP Pathways Include Activities from Fertilizer to Ethanol at Stations
Key Issues for WTW Analysis of Bio-Ethanol • Key stages affecting WTW GHG results • Use of fertilizer in farms • Nitrogen fertilizer • Lime • Energy use for farming • Energy use of ethanol production • Co-products • Animal feeds for corn ethanol • Electricity for cellulosic ethanol • The debate on energy balance (energy in ethanol minus fossil energy used) is NOT meaningful, even though most studies concluded positive balance for corn ethanol • Supply of corn ethanol may be limited relative to the U.S. transportation fuels market • In 2005, of the 11.1 billion bushels of corn produced, 13% was used for producing ethanol • In 2005, 4.2 billion gallons of ethanol was used, equivalent to 2.8 billion gallon of gasoline • In 2004, the U.S. consumed 141 billion gallons of gasoline and 37 billion gallons of on-road diesel
0.65 0.60 ? 0.55 0.50 Precision farming, etc.? Bushels/lb. Fertilizer 0.45 0.40 0.35 0.30 1965 1970 1975 1980 1985 1990 1995 2000 2005 Accurate Ethanol Energy Analysis Must Account for Increased Productivity in Farming Over Time U.S. Corn Output Per Pound of Fertilizer Has Risen by 70% in The Past 35 Years Based on historical USDA data; results are 3-year moving averages
Improved Technology Has Reduced Energy Use and Operating Costs in Corn Ethanol Plants From Argonne’s discussions with ethanol plant designers, USDA data, and other reported data
Accounting for Animal Feed Is a Critical Factor in Ethanol’s Lifecycle Analysis Argonne uses the displacement method, the most conservative approach.
Energy Effects of Fuel Ethanol Depend on the Type of Energy Being Analyzed Total Energy Fossil Energy Petroleum Energy Total Btu Spent for One Btu of Gasoline and Ethanol Available at Fuel Pumps
Wang GREET w/Pimentel Assumptions Most of the Recent Corn EtOH Studies Show a Positive Net Energy Balance Energy balance here is defined as Btu content a gallon of ethanol minus fossil energy used to produce a gallon of ethanol
N2O and NOx Emissions from Nitrogen Fertilizer Are a Major Emission Source • Argonne’s analysis shows that depending on soil type and condition, 1-3% of N in nitrogen fertilizer is converted into N in N2O • On the well-to-wheels basis, N2O emissions from that conversion could account for up to 25% of total GHG emissions from corn ethanol • For economic reasons, N fertilizer use per bushel of corn has reduced in the U.S.; this has positive side effects on reducing environmental pollution and GHG emissions • Also, application of lime results in non-trivial CO2 emissions for corn ethanol (throguh the process of converting lime stone [CaCO3] to lime [CaO])
Corn EtOH Reduces GHGs by 15-26% While Cellulosic EtOH Yields 87% Reduction, on Per Gallon Basis of EtOH Used GHG Emission Reductions Per Gallon of Ethanol to Displace An Energy-Equivalent Amount of Gasoline
Cellulosic Ethanol from Crop and Forest Residues Can Achieve Large GHG Reductions
Opportunities and Challenges of Near Future U.S. Corn Ethanol Production Opportunities • Corn yield/acre will continue to increase, together with stabilized or reduced N fertilizer application • Ethanol yield/bushel will continue to increase • Energy use in ethanol plants may be reduced further through better engineering, integration of ethanol production and animal feedlots • Gasification of biomass to provide process energy for ethanol plants Challenges • Switch from natural gas to coal in ethanol plants • Potential use of marginal land for additional corn production
Biological Process Protein Feed Biological process Separation Ethanol Power Plant: Gas or Steam Turbine Wastewater Treatment Electricity Thermochemical Process FTD or DME Feed Gasification Gas Cleanup Fuel Synthesis FTG, FTN Power Plant: Gas Turbine Electricity Bio-EtOH, -FTD, -DME Produced from Two Processes M. Wu, Y. Wu, and M. Wang, 2006, “Energy and Emission Benefits of Alternative Transportation Liquid Fuels Derived from Switchgrass: a Fuel Life Cycle Analysis,” forthcoming in Journal of Biotechnology Progress.
Shares of Biofuels and Co-Products (Based on Energy Content) Vary for Different Cases Production Scenarios Transportation Fuel Power Others EtOH/GTCC 79.6% 20.4% EtOH/Rankine 88.2% 11.9% Multi-Fuel 89.9% 1.8% 8.3% EtOH/Protein/Rankine 83.2% 3.5% 13.3% DME/GTCC 44.7% 55.3% FTD/GTCC 36.8% 40.4% 22.9% • Bio-EtOH has the largest amount of energy share in fuel products. • Thermochemical process generates similar amount of energy between fuel and power.
Million Btu per ton biomass Energy Benefits of Biofuels Vary Among Different Production Cases
GHG Benefits of Biomass Use Are from Production of Fuels and Power Grams of CO2 and GHGs Reductions Per Dry Ton of Biomass
A Group of Vehicle/Fuel Systems Was Analyzed A complete WTW evaluation, targeting energy use, GHGs (CO2, CH4 and N2O) and typical criteria air pollutants (VOC, NOX and PM10), was conducted for MY2010 vehicles (midsize passenger car platform) at midpoint of lifetime mileage (2016). Wu, Y., M. Wang, P. Sharer, and A. Rousseau, 2006, “Well-to-Wheels Results of Energy Use, Greenhouse Gas Emissions, and criteria Pollutant Emissions of Selected Vehicle/Fuel Systems,” SAE paper 2006-01-0377
Fuel Economy of Vehicle Technologies Was Simulated with Argonne’s PSAT Model • PSAT was used to estimate vehicle fuel economy for • MY2010 midsize passenger car as platform • Baseline SI ICE was based on PSAT calibration of the EIA projections • Advanced SI ICE and other advanced vehicle technologies were based on FreedomCAR goals • PSAT results were adjusted to reflect on-road MPG On-road Adjusted Fuel Economy (55% UDDS and 45% HWY Cycle), mpgge
2010 Model-Year Vehicles Were Assumed to Meet EPA Tier 2 Emission Standards Tier 2 Standards (PCs and LDTs, g/mi. for 120K miles)
Advanced Vehicle/Fuel Systems Could Achieve Moderate to Large Reductions in Energy Use For WTW results, it is important to pay attention to both amount and type of energy use among vehicle/fuel technologies.
NOX Emission Reductions by Advanced Vehicle/Fuel Systems Follow Similar Trends As for VOC Emissions, But WTP Stage Becomes a Dominant Source for Total NOx
From ICEVs to HEVs and to FCVs, GHG Emissions Continue to Be Reduced
Outstanding Life-Cycle Analysis Issues • Baseline crude for gasoline and diesel production • Conventional crude vs. unconventional crude • Technology advancement over time need to be considered • Vehicle technologies for fuel economy and emissions • Fuel requirements and production technologies • Transparency should be emphasized in WTW analysis and results • System boundary issues will continue to be debated • WTW analysis includes operation-related activities, but usually does not include infrastructure-related activities such as building of petroleum refineries • It is critical to maintain a consistent boundary for all fuels • No silver-bullet fuel exists to solve all problems, trade-offs among impacts need to consider • Energy security • GHG emissions • Urban air pollution • Other environmental issues need to be addressed • Water resource use and waste water discharge • Land use, especially for biofuels