Download
1 / 1
10 likes | 126 Views
Frequency, cm -1. Frequency, cm -1. Frequency, cm -1. 32000. 30000. 28000. 26000. 24000. 32000. 30000. 28000. 26000. 24000. 32000. 30000. 28000. 26000. 24000. 100. 100. Frequency, cm -1. 100. 1. 3. 20000. 19000. 18000. 17000. 16000. 15000. Frequency, cm -1. 5. 5.

E N D
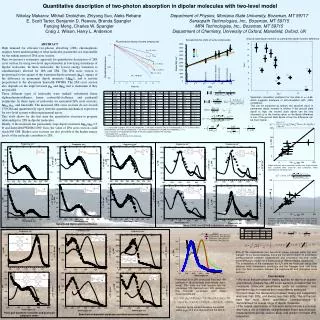
Frequency, cm-1 Frequency, cm-1 Frequency, cm-1 32000 30000 28000 26000 24000 32000 30000 28000 26000 24000 32000 30000 28000 26000 24000 100 100 Frequency, cm-1 100 1 3 20000 19000 18000 17000 16000 15000 Frequency, cm-1 5 5 150 80 20000 19000 18000 17000 16000 15000 80 300 9 , 104 M-1cm-1 Qx(2) 80 7 Qx(2) 4 3.75 250 4 5 60 60 s2, GM , 104 M-1cm-1 60 s2, GM 100 s2, GM 3 2.5 , 104 M-1cm-1 200 3.75 2.5 3 40 40 s2, GM 40 2 , 104 M-1cm-1 Qx(1) Qx(1) 150 s2, GM 2.5 , 104 M-1cm-1 1.25 50 20 20 1.25 2 20 1 100 1.25 0 0 50 1 0 0 0 0 0 300 320 340 360 380 400 420 440 300 320 340 360 380 400 420 440 300 320 340 360 380 400 420 440 0 32000 30000 28000 26000 24000 32000 30000 28000 26000 24000 22000 20000 80 32000 30000 28000 26000 24000 0 600 140 500 540 580 620 660 700 20000 19000 18000 17000 16000 15000 0 20000 19000 18000 17000 16000 15000 200 6 4 70 60 500 540 580 620 660 700 2 Qx(2) 120 Qx(2) 500 8 10 4 60 50 100 150 12 400 50 , 104 M-1cm-1 2 8 40 80 3 4 , 104 M-1cm-1 40 s2, GM s2, GM s2, GM 9 300 100 , 104 M-1cm-1 6 60 Qx(1) 30 30 s2, GM 3 , 104 M-1cm-1 2 s2, GM , 104 M-1cm-1 1 6 200 Qx(1) 40 4 20 1 20 9, =3.11 ns 300 2 50 1 20 3 100 10 2 0.1 300 1, =1.71 ns 10 1 0 0 0 0 0 0 0 6, =1.46 ns 200 300 340 380 420 460 500 300 320 340 360 380 400 420 440 300 320 340 360 380 400 420 440 0 0 0 0.01 Normalized fluorescence Wavelength, nm Wavelength, nm Wavelength, nm 500 540 580 620 660 700 200 4, =1.28 ns 500 540 580 620 660 700 Substituted diphenylaminostilbenes 11 Wavelength, nm 2, GM 2 12, =1.14 ns Wavelength, nm Meso-DPAS and BDPAS-substituted porphyrins 11, =0.86 ns 11 2, GM 2 10-3 12 100 Frequency, cm-1 5 3 12 0 1 2 3 4 5 6 7 100 32000 30000 28000 26000 24000 22000 20000 1 Frequency, cm-1 4 14 Time, ns 6 5 7 8 3 32000 30000 28000 26000 24000 22000 20000 1200 Frequency, cm-1 400 9 6 13 5 0 4 1 5000 10 4 7 18000 17000 16000 15000 14000 150 9 8 4500 0 1000 10 1 Qx 5 4000 300 4 11 0 100 200 300 2, GM 5 3.75 3 3500 10 800 0 100 200 300 2, GM 3000 s2, GM 100 , 104 M-1cm-1 3.75 2500 200 Stokes Shift, cm-1 2 600 s2, GM , 104 M-1cm-1 2000 2.5 s2, GM 1500 , 104 M-1cm-1 isobutyl isobytyrate 2.5 400 100 1000 isobutyl acetate 2-chlorobutane 1 butyl ether n-octane pentanal 50 500 1.25 15 0 200 1.25 0.0 0.1 0.2 0.3 0.4 0.5 0 0 Experimental 2PA spectrum Df(D) 300 350 400 450 500 Experimental 1PA spectrum 0 16 0 2 5 Theoretical 2PA spectrum 0 0 300 350 400 450 500 Theoretical 1PA spectrum 14 34000 32000 30000 28000 26000 24000 22000 350 34000 32000 30000 28000 26000 4 400 500 560 600 640 680 720 4 12 1 18000 17000 16000 15000 14000 13000 250 300 6 16 10 400 12 14 300 5 3 |01| 250 3 200 8 8 2, GM 11 300 s2, GM 8 200 3.75 6 200 s2, GM 12 7 150 , 104 M-1cm-1 2 4 150 , 104 M-1cm-1 6 s2, GM 2.5 10 200 Qx 2 100 100 100 , 104 M-1cm-1 9 4 1 0 1.25 100 50 |00| 1 10 50 0 2 250 300 350 400 450 500 550 0 0 0 0 Wavelength, nm 280 320 360 400 440 280 300 320 340 360 380 400 0 0 Push-pull porphyrin monomer and push-pull porphyrin dimer Wavelength, nm Wavelength, nm 650 700 750 800 850 Wavelength, nm Quantitative description of two-photon absorption in dipolar molecules with two-level model Nikolay Makarov, Mikhail Drobizhev, Zhiyong Suo, Aleks Rebane E. Scott Tarter, Benjamin D. Reeves, Brenda Spangler Fanqing Meng, Charles W. Spangler Craig J. Wilson, Harry L. Anderson Department of Physics, Montana State University, Bozeman, MT 59717 Sensopath Technologies, Inc., Bozeman, MT 59715 MPA Technologies, Inc., Bozeman, MT 59715 Department of Chemistry, University of Oxford, Mansfield, Oxford, UK Ground state dipole moment vs. permanent dipole moment difference Solvatochromic shifts of some compounds Fluorescence decay of some compounds ABSTRACT High demand for efficient two-photon absorbing (2PA) chromophores requires better understanding of what molecular parameters are responsible for the enhancement of 2PA cross section. Here we present a systematic approach for quantitative description of 2PA cross section by using two-level approximation in low-lying transitions of dipolar molecules. In these molecules, the lowest energy transition is simultaneously allowed for 1PA and 2PA. The 2PA cross section is proportional to the square of the transition dipole moment (|01|), square of the difference in permanent dipole moments (|01|), and is inverse proportional to the absorption linewidth FWHM. The 2PA cross section also depends on the angle between 01 and 01 and is maximum if they are parallel. Three different types of molecules were studied: substituted linear diphenylaminostilbenes, linear carbazolyl-stylbenes, and push-pull porphyrins. In these types of molecules we measured 2PA cross sections, 01, 01, and linewidth. The measured 2PA cross sections do not exceed 150 GM and quantitatively agree with the quantum-mechanical expression for two-level system within experimental errors. This work shows for the first time the quantitative structure-to-property relationship for 2PA in dipolar molecules. Ideally, if the molecule has particularly large dipole moments 01=01=15 D and linewidth FWHM=1000 1/cm, the value of 2PA cross section could reach 900 GM. Higher cross sections are also possible if the higher energy levels of the molecule contribute to 2PA. Spearman correlation coefficient for the data is =–0.69, which suggests existence of anti-correlation with ~98% confidence. This can be explained as follows: the absolute value of permanent dipole moment is limited. If the ground state dipole is high, the excited state dipole can be only increased up to the limiting value, so the dipole difference is low. If the ground state dipole is low, the difference can be much higher. S1is measured in toluene (D=2.4) for compounds 1, 3-6 and in n-octane (D=2.0) for compounds 2, 7-11; is measured in tetrahydrofuran (D=7.58) for compounds 1, 3-6 and in 2-chlorobutane (D=8.06) for compounds 2, 7-11. *Cross section at the doubled wavelength of the lowest dipole-allowed 1PA transition. **Calculated from FM and F. ***Calculated from the density of the molecules. Dipole moments were measured, and the line shape function was assumed both Gaussian and Lorentzian. More uncertainty on horizontal axes. Extinction, central frequency, solvatochromic shifts and the molecular radii were measured, and the line shape function was assumed to be the same as in 1PA. Less uncertainty on horizontal axes. 83% of the experimental and theoretical values coincide within the error margins. To our best knowledge, this is the first demonstration of quantitative correspondence between experimental and theoretical two-level model based 2PA cross section for a broad range of different dipolar compounds. The combination of the expression for 2(b) with the molecular radius data obtained from fluorescence anisotropy and the Onsager local field factor gives the best correlation between the experimental and theoretical cross sections. • Conclusions • We show that perturbation theory applied for two-level system quantitatively predicts the 2PA cross sections, provided that the necessary molecular parameters such as transition- and permanent dipole moments are independently measured. • In most cases, the discrepancy between theory and experiment was less than 20%, and always less than 50%. This is the first time that such direct quantitative correspondence is demonstrated for a wide range of dipolar molecules. • The overall significance of this work demonstrates a practical way how a set of relatively straightforward linear spectroscopic measurements can be used to study and predict nonlinear 2PA properties. Theoretical fit of 2PA (thick solid line) and 1PA (dashed) of 13 using three level density matrix model. Thin solid line and squares are the normalized 1PA spectrum and 2PA spectrum. The molecular parameters from linear measurements are: Transition dipole moment between the excited states |12|=13.5 D is obtained from the best fit. Substituted carbazolyl-stylbenes and diphenylaminostilbenes