Download
1 / 14
180 likes | 283 Views
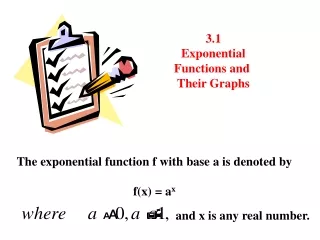
Digital Lesson. Exponential Functions and Their Graphs. Definition of Exponential Function. The exponential function f with base a is defined by f ( x ) = a x where a > 0, a 1, and x is any real number. For instance, f ( x ) = 3 x and g ( x ) = 0.5 x

E N D
Digital Lesson Exponential Functions and Their Graphs
Definition of Exponential Function The exponential function f with base a is defined by f(x) = ax where a > 0, a 1, and x is any real number. For instance, f(x) = 3x and g(x) = 0.5x are exponential functions.
The value of f(x) = 3x when x = 2 is f(2) = 32= 9 The value of f(x) = 3x when x = –2 is f(–2) = 3–2 = The value of g(x) = 0.5x when x = 4 is g(4) = 0.54= 0.0625
The graph off(x) = ax, a > 1 Graph of Exponential Function (a > 1) y 4 Range: (0, ) (0, 1) x 4 Horizontal Asymptote y = 0 Domain: (–, )
The graph off(x) = ax, 0 < a < 1 Graph of Exponential Function (0 < a < 1) y 4 Range: (0, ) Horizontal Asymptote y = 0 (0, 1) x 4 Domain: (–, )
Example: Sketch the graph off(x) = 2x. Example: Graph f(x) = 2x y 4 2 x –2 2
Example: Sketch the graph ofg(x) = 2x – 1. State the domain and range. Example: Translation of Graph y f(x) = 2x The graph of this function is a vertical translation of the graph of f(x) = 2x downone unit . 4 2 Domain: (–, ) x y = –1 Range: (–1, )
Example: Sketch the graph ofg(x) = 2-x. State the domain and range. Example: Reflection of Graph y f(x) = 2x The graph of this function is a reflection the graph of f(x) = 2x in the y-axis. 4 Domain: (–, ) x –2 2 Range: (0, )
Example: Sketch the graph ofg(x) = 4x-3 + 3. State the domain and range. Example: Reflection of Graph y Make a table. x y 4 1 3.0625 2 3.25 3 4 x 4 7 –2 2 5 19 Domain: (–, ) Range: (3, ) or y > 3
The Natural Base e The number e The irrational number e, where e 2.718281828… is used in applications involving growth and decay. Using techniques of calculus, it can be shown that
The graph off(x) = ex Graph of Natural Exponential Function f(x) = ex y 6 4 2 x –2 2
Example: Sketch the graph ofg(x) = ex-5 + 2. State the domain and range. y Make a table. x y 4 7 9.39 6 4.72 5 3 x 4 2.36 –2 2 3 2.14 Domain: (–, ) Range: (2, ) or y > 2
Interest Applications Formulas for Compound Interest— 1.) compound per year -- A = P 1 + r nt n r is the rate n is the number times you compound your money per year t is time. Balance in account Principal ($ you invest) 2. Compounded continuously– A = Pert
A total of $12000 is invested at an annual interest rate of 9%. Find the balance after 5 years if it is compoundeda. quarterlyb. monthlyc. continuously