Download
1 / 23
230 likes | 374 Views
Charged Nanograins in the Enceladus Plume. Tom Hill , Rice Univ. Michelle Thomsen , LANL Robert Tokar , LANL Andrew Coates , MSSL Gethyn Lewis , MSSL Dave Young , SWRI Frank Crary , SWRI. Raul Baragiola , Univ. VA Bob Johnson , Univ. VA Geraint Jones , MSSL Don Mitchell , JHU/APL

E N D
Charged Nanograins in the Enceladus Plume Tom Hill, Rice Univ. Michelle Thomsen, LANL Robert Tokar, LANL Andrew Coates, MSSL Gethyn Lewis, MSSL Dave Young, SWRI Frank Crary, SWRI Raul Baragiola, Univ. VA Bob Johnson, Univ. VA Geraint Jones, MSSL Don Mitchell, JHU/APL Jan-Erik Wahlund, IRFU Rob Wilson, LANL Yaxue Dong, Rice Univ. Mihaly Horanyi, Univ. CO MOP Conference, Boston, 11 July 2011
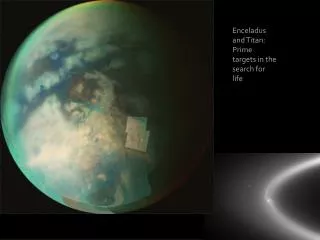
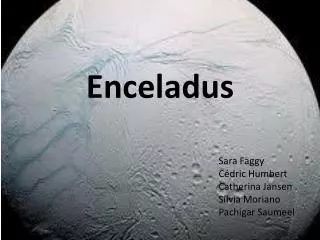
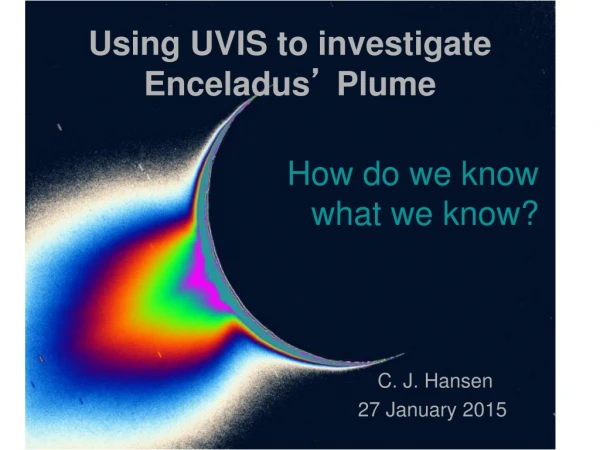
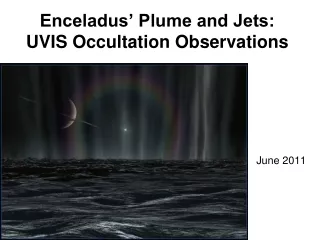
The South polar plumeof Enceladus is revealed here in visual- light images of sunlight forward-scattered by micron-size grains (Cassini ISS, Porco et al., 2006 Science). This later image, also showing the E Ring, is from www.ciclops.org/view.php?id=2086 MOP Conference, Boston, 11 July 2011
This South polar Enceladus plume also contains: • Supersonic water vapor with interesting trace impurities (Cassini INMS, • Waite et al., 2006 Science; Cassini UVIS, Hansen et al., 2006 • Science; Dong et al. poster, this meeting); • Cold negative water-cluster molecular ions (CAPS-ELS, Coates et al., 2009 Icarus); • Cold positive water-group ions (CAPS-IMS, Tokar et al., 2009 GRL); • Dense plasma with ni >> ne (RPWS-LP, Shafiq et al., 2010 PSS); • and • Charged nanometer-size grains (CAPS, Jones et al., 2009 GRL; this talk). MOP Conference, Boston, 11 July 2011
The cold, charged nanometer-size grains (nanograins) are detectable by CAPS (Cassini Plasma Spectrometer) when CAPS has ram pointing during a plume encounter. This has occurred 3 times to date: E3 (12 Mar 2008) E5 (09 Oct 2008) E7 (02 Nov 2009) All 3 encounters very nearly crossed the south polar axis of Enceladus, but at quite different distances: Z(E3) ~ -3.6 RE Z(E5) ~ -2.3 RE Z(E7) ~ -1.4 RE MOP Conference, Boston, 11 July 2011
CAPS count-rate spectrograms during E3 encounter: ELS: (-) grains (-) clusters electrons IMS: (+) grains (+) ions MOP Conference, Boston, 11 July 2011
CAPS count-rate spectrograms during E5 encounter: ELS: (-) grains (-) clusters electrons SNG: (+) grains (+) ions MOP Conference, Boston, 11 July 2011
The nanograins are cold, as evidenced by the fact that comparison of adjacent CAPS 20° angular sectors (not shown here) indicates an angular beam width < (and possibly <<) 20°. Thus, the best way to extract particle density n from observed count rate CR is the cold-beam algorithm introduced by Coates et al. (2007 GRL) for cold heavy negative ions in Titan’s atmosphere: CR = nvA where = detector’s counting efficiency, v = beam speed relative to Cassini, and A = detector’s effective collecting area. We approximate v by the spacecraft encounter speed relative to Enceladus: vv(ram) = 14.4 km/s for E3 encounter 17.7 km/s for E5 encounter 7.7 km/s for E7 encounter (Beam speed relative to Enceladus is not known but is evidently << v(ram).) MOP Conference, Boston, 11 July 2011
Instrument-dependent parameters in this formula: • Effective collecting area A 0.33 cm2 (ELS) or 0.32 cm2 (IMS), • ± ~ 10% (?) • Counting efficiency ~ 0.05 (ELS) versus ~ 1 (IMS) • ± factor ~ 3 (?) • (The big difference between (IMS) and (ELS) results from the fact that IMS has start foils and ELS does not.) MOP Conference, Boston, 11 July 2011
The cold-beam approximation gives a simple linear conversion between energy/charge (E/q, the measured quantity) and mass/ charge (m/q, the intrinsic grain property): (E/q)/(m/q) = E/m = v2/2 1.1 eV/amu for E3 encounter 1.6 eV/amu for E5 encounter 0.31 eV/amu for E7 encounter Evaluating the cold-beam formula for each E/q channel (= m/q channel) gives the mass spectrum of charged nanograins dn/dm = (number density of grains)/(mass channel) assuming singly-charged grains (q = ± e; see below). MOP Conference, Boston, 11 July 2011
Mass spectrum dn/dm for the E3 encounter, for the nanograin portions of the CAPS ELS and IMS E/q ranges, near the respective times of peak nanograin flux. Note that the spectrum is still increasing, or flat, at the top of the CAPS E/q ranges. We can only provide a lower limit to the total nanograin density. MOP Conference, Boston, 11 July 2011
Mass spectrum dn/dm for the E5 encounter, for the nanograin portions of the CAPS ELS and IMS E/q ranges, near the respective times of peak nanograin flux. Note that the spectrum is (again) still increasing, or flat, at the top of the CAPS E/q ranges. We can (again) only provide a lower limit to the total nanograin density. MOP Conference, Boston, 11 July 2011
Integrating dn/dm over m gives total nanograin density within the CAPS E/q range. Same scales for both encounters. Note that n(-) >> n(+) on both encounters, and that n(E3) > n(E5) even though E3 was 2X farther from the surface vents. MOP Conference, Boston, 11 July 2011
Thelater (and much closer) E7 encounter showed no evidence of (+) nanograins, and a much weaker (but detectable) signal from (-) nanograins with peak total density ~ 1.5/cm3. The following figure compares the peak nanograin densities for the three plume encounters to date, with CAPS ram pointing. The next such encounter (E14), similar to E7, will occur 1 Oct 2011. (Ask me about our prediction for that encounter.) MOP Conference, Boston, 11 July 2011
(r = distance from south pole on surface, not from center of Enceladus.) The nanograin density clearly does not follow the canonical 1/r2 dependence. By contrast, The neutral H2O vapor density measured by INMS does indeed follow the expected 1/r2 dependence for all three encounters, with similar source densities for all three (Dong et al. poster, this meeting). MOP Conference, Boston, 11 July 2011
An inescapable (to me) conclusion: The nanograins are not significantly charged (e.g., by triboelectric charging) when they leave the surface vents. They are primarily charged by plasma electron impact in transit from Enceladus to Cassini. MOP Conference, Boston, 11 July 2011
Another, even more inescapable, conclusion: The observed nanograins carry a significant unbalanced charge density (n(-) >> n(+)), which increases with distance from the source. Taken in isolation, this would be an embarrassing problem, and would call the CAPS observations into question. However, it fits rather nicely with an opposite charge-imbalance problem posed by the RPWS-LP measurement (Shafiq et al., 2011 PSS) of a plume plasma with n(+) >> n(-) on the E3 plume encounter. The numbers don’t quite match – plasma n(+) - n(-) >~ nanograin n(-) - n(+), but recall that CAPS can give only a lower limit for the latter. MOP Conference, Boston, 11 July 2011
Taken together, the CAPS and RPWS-LP measurements support the notion that the nanograins absorb many of the electrons (an increasing fraction with increasing distance from the source) that balance the charge density of the (+) plasma ions. MOP Conference, Boston, 11 July 2011
Conclusions: • Nanograins are a ubiquitous feature of the Enceladus plume. • They become charged by electron impact in the plasma, not by friction in the surface vents. • The most likely (nonzero) charge state is q = -e. • They interact strongly with the dense plume plasma and carry a significant fraction of the negative charge, increasingly so with increasing distance. • They provide an important source of both the particulate E ring and the magnetospheric plasma. MOP Conference, Boston, 11 July 2011
Back-up slides MOP Conference, Boston, 11 July 2011
Why is q = ±e the most plausible value? • q = 0 is probably the most likely value, but is not detectable by CAPS. • Multiple charges are possible, but implausible because: • “ghost peaks” are not seen in the data; • the expected charging time, when converted to distance, is >~ the • distance from the source; and • multiple charges would repel each other. MOP Conference, Boston, 11 July 2011
RPWS-LP measurements on E3 encounter (Shafiq et al., 2011 PSS): Max ni ~ 105/cm3 Max ne ~ 103/cm3 Inferred sub-micron dust density ~ 100/cm3 in plume. Inferred charging timescale ~ 10 s for 30 nm dust. MOP Conference, Boston, 11 July 2011
Physical displacement between (-) and (+) grains (E3) – This is in the wrong direction to be explained by the remnant corotation electric field. MOP Conference, Boston, 11 July 2011
Prediction for E14 encounter on 1 October: Nanograin signature will be weak or absent, like E7, because of proximity to the source. MOP Conference, Boston, 11 July 2011