Download
1 / 33
330 likes | 538 Views
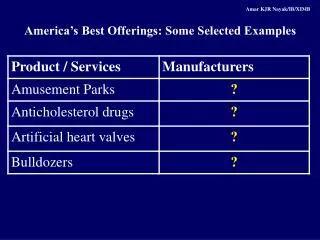
Amar KJR Nayak/IB/XIMB. America’s Best Offerings: Some Selected Examples. Amar KJR Nayak/IB/XIMB. America’s Best Offerings: Some Selected Examples. Amar KJR Nayak/IB/XIMB. DEVELOPMENT OF TECHNOLOGY A COMPARISON. 2010. 1990. 1970. 1945.

E N D
Amar KJR Nayak/IB/XIMB America’s Best Offerings: Some Selected Examples
Amar KJR Nayak/IB/XIMB America’s Best Offerings: Some Selected Examples
Amar KJR Nayak/IB/XIMB DEVELOPMENT OF TECHNOLOGY A COMPARISON 2010 1990 1970 1945 Source: Wharton Executive Program in Kitakyushu, Prof. Graham Mitchell, 2001
Amar KJR Nayak/IB/XIMB DEVELOPMENT OF TECHNOLOGY A COMPARISON 2010 1990 1970 1945 Source: Wharton Executive Program in Kitakyushu, Prof. Graham Mitchell, 2001
Amar KJR Nayak/IB/XIMB America’s Best Offerings: Some Selected Examples
Amar KJR Nayak/IB/XIMB America’s Best Offerings: Some Selected Examples
Amar KJR Nayak/IB/XIMB America’s Best Offerings: Some Selected Examples
Amar KJR Nayak/IB/XIMB America’s Best Offerings: Some Selected Examples
a = 1950 b = 1960 c = 1970 d = 1980 e = 1990 f = 1992 Amar KJR Nayak/IB/XIMB US Share of World GDP, 1950 – 1992 Based on 1985 Prices Source: National Bureau for Economic Research, March, 1997
Amar KJR Nayak/IB/XIMB R&D Facilities of Foreign Companies in USA Source: 1998 Data, Wharton Executive Program
Amar KJR Nayak/IB/XIMB OTHER DEVELOPMENTS IN TECHNOLOGY The cost of arriving late to market Pg. 274, Text 10 Design changes using concurrent engineering v/s sequential engineering Reduction in lead times of product development: Japan, Europe & U.S. Information and communications technologies (ICT)
Amar KJR Nayak/IB/XIMB OTHER DEVELOPMENTS IN TECHNOLOGY Challenges & Opportunities Internet Business – Hurdle of language to Japanese companies Systematic Gathering, Organizing, Processing, and Using of information (7/11 Stores) Netherlands – Mobile Phones
Amar KJR Nayak/IB/XIMB International Strategy in Technology & R&D SCIENCE V/S TECHNOLOGY RESEARCH V/S DEVELOPMENT Key Characteristic PATH DEPENDENT
Amar KJR Nayak/IB/XIMB Evolution Process Product Innovation -> Dominant Design -> Process Innovation Technology as a strategic asset New functions New features Greater reliability Lower costs
Amar KJR Nayak/IB/XIMB Technology is one of the underlying reasons for the existence of a product life cycle
Components of Technology Strategy Technology Audit Sourcing New Technology Exploiting Technology Protecting the Competitive Advantage
Amar KJR Nayak/IB/XIMB INNOVATION AUDIT Innovation Process Audit: Length & Depth of Company Experience Innovation Comparison Audit With Competition
Amar KJR Nayak/IB/XIMB SOURCING NEW TECHNOLOGY Technology categories
Amar KJR Nayak/IB/XIMB SOURCING NEW TECHNOLOGY Technology categories
Amar KJR Nayak/IB/XIMB Optimum entry methods for new technologies Decreasing familiarity with technology
Amar KJR Nayak/IB/XIMB EXPLOITING NEW TECHNOLOGY Location of R&D A qualified policy of centralization in R&D Transfer of knowledge from host to home
Amar KJR Nayak/IB/XIMB EXPLOITING NEW TECHNOLOGY Location of R&D Modification of products developed by parents for local use Transfer for organizational learning (Methe & Yoshihava)
Amar KJR Nayak/IB/XIMB PROTECTING TECHNOLOGY Patent Exclusive right to the benefits of the technology (20 years in US) Trade secret Lengthy, Complex Contractual Agreements Umbrella Contracts
Amar KJR Nayak/IB/XIMB Technology Strategy in Action A Case Sharp Corporation http://sharp-world.com/worldwide/index.html
SHARP About the Company Establish in the year 1912 by Tokuji Hayakawa. The name comes from an innovation, the "Ever Sharp" automatic pencil from 1915. Tokuji Hayakawa began his business with just 50 yen -- equivalent to 150,000 yen in 1992 – including a 40 yen loan. In May, 1949 the company was listed for the first time on the Osaka Stock Exchange. In 1956 there were "three sacred treasures" in Japan: the washing machine, the refrigerator and the television The company began setting up independent regional sales subsidiaries across Japan in 1958 In 1962, the company's first overseas sales subsidiary -- Sharp Electronics Corporation (SEC) -- was established in New York City. Company’s revenue in the year 2005 was ¥ 2,539,859 million
SHARP Profile of SHARP Corporation Business Creed Sincerity and Creativity Established 1912 Capital Stock ¥ 204, 066 Million (March, ‘00) Employees 60,200 (April, ‘00) Domestic: 32,170 Overseas: 28,030 Revenue 1998 (ending March 1999) 2005 (ending March 2006) (Consolidated in million) ¥ 1,745,537 ¥2,539,859
SHARP Development of Key Technologies that Support the Digital New Life21 Human Interface Voice Interface Image Interface Technology – Content digitizing technology Energy / Environments Solar Cell Panel / Solar Cell Home Energy Supply System Recycle System – e.g. Recycling resin Device Electronics Devices – e.g. Semiconductor lasers Mobile Communication Devices – e.g. Very low power consumption LSI for mobile gears Network Technology Home Network Technology – e.g. 1394 POF, MMAC, Millimeter-wave Image Transmission Mobile Network Technology – e.g. Application specific terminals Network Service Technology Next Generation Display -- e.g. Next generation HR-TFT (reflective LC display) for Mobile Application
SHARP Revenue ¥ 2,539,859 Mil Transition of Business Structure Revenue ¥ 2,012,858 Mil. Consumer Products 27% Revenue ¥ 1,854,774 Mil. Revenue ¥ 1,745,537 Mil. Consumer Products 28% Revenue ¥ 1,650,708 Mil Consumer Products 35% Information/ Communication Products 36% Consumer Products 40% Revenue ¥1,216,048 Mil Information/ Communication Products 36% Consumer Products 48% Information/ Communication Products 32% Consumer Products 67% Information/ Communication Products 32% Information/ Communication Products 25% Devices 36% Devices 37% Devices 33% Information/ Communication Products 24% Devices 28% Devices 27% Devices 9% 1985 1995 1998 1999 2001 2005
New Spiral Evolution of LCD Technologies, Devices and Products SHARP Products/Systems Motion pictures Thin/light weight LCD View Cam LCD Projector Wall – mount TV Color Zaurus (Color PDA) Mebius (Color note PC) Low price Low power consumption Thin STN LCDs DST LCDs Large-screen TFT color LCDs (14’’ 17’’ 24’’) Next generation LCDs Film LCDs Low temperature P-Si TFT Ferroelectric LCDs Plastic LCDs Early 1980s ~ 1990s Low drive voltage Thin calculators With LCDs Low power consumption TN LCDs (dot-matrix) DSM LCDs Early 1970s Early 1970s Late 80s~early 90s ~2000s~ Late70s~early80s Early 1970s Scientific calculators, word processors Pocket computers, electronics translators. Products/systems High contrast Wide viewing angle Large screen color Late 1970s ~ early1980s PALC CGS TFT Development of Multimedia Next – generation AV Communication Information systems HDTV Devices Products/ Systems Large screen/ High definition High speed Response ~ 2000 ~
SHARP R & D Meetings Corporate Management Meeting [Corporate R & D Group] [Business Operation Groups] Mid to Long Term R & D Strategy Mid to Long Term Business Strategy Corporate R & D Meeting R & D Plan Reviewing R & D Strategy Technical Review Meeting R & D Strategy Meeting R & D Promotion Meeting “GLOBAL BADGE” SPECIAL – PROJECT TEAMS Laboratories Laboratories/Business Divisions
SHARP “GOLD BADGE” Special – Project Team “Gold Badge” Special – Project Team were established in order to bring strategic Products into the marketplace as fast as possible OBJECTIVE • Operated by one leader per team. • Bringing members from Corporate R & D Group, Production Technology Group, • Products Groups, and Components Groups. • Integrating relevant Sharp technologies. ORGANIZATION TERM 1 ~ 1.5 Years • The team receives a top priority in the allocation of manpower and facilities. • Members wear a badge the same as the president’s badge (gold color) • Operated by Sharp headquarters’ budget. CHARACTERISTICS
SHARP Global R & D Activities • R & D activities in Japan • R & D for key technologies which will contribute to • Creating a whole new market arena. • Development of Highly Value – added products R & D Strategy Meeting, Joint Development Project, Global Interchange of Human Resources and so forth Sharp Laboratories of Europe Contributing to creating new business through R & D Activities utilizing advanced key technologies in the U.K and Europe Sharp Laboratories of America R & D of new technologies utilizing the most advanced Technology of American in the multimedia field based on its infrastructure and market needs • Example • Next Generation LCD display • Multilingual Machine Translation System • Example • Digital Image Processing • Multimedia Communication Technology • Information Processing Technology