NITRIFICATION PLANS
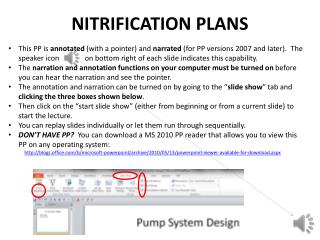
NITRIFICATION PLANS. This PP is annotated (with a pointer) and narrated (for PP versions 2007 and later). The speaker icon on bottom right of each slide indicates this capability.

NITRIFICATION PLANS
E N D
Presentation Transcript
NITRIFICATION PLANS • This PP is annotated (with a pointer) and narrated (for PP versions 2007 and later). The speaker icon on bottom right of each slide indicates this capability. • The narration and annotation functions on your computer must be turned on before you can hear the narration and see the pointer. • The annotation and narration can be turned on by going to the “slide show” tab and clicking the three boxes shown below. • Then click on the “start slide show” (either from beginning or from a current slide) to start the lecture. • You can replay slides individually or let them run through sequentially. • DON’T HAVE PP? You can download a MS 2010 PP reader that allows you to view this PP on any operating system: • http://blogs.office.com/b/microsoft-powerpoint/archive/2010/05/13/powerpoint-viewer-available-for-download.aspx
Water Utility Nitrification Plan Development version 3 (February 14, 2014) Steve Hubbs shubbs@coronaenv.com
Outline • Purpose – to help water utility managers and operators develop nitrification plans • Elements • Pre-event planning • Historical data review • Developing chlorine system demand curves • Developing monitoring protocol • setting benchmarks • Establishing action items corresponding to benchmarks • Feedback after nitrification event for improving utility action plan • Feedback to Steve for improving PP
Nitrification Nitrifying bacteria feed on ammonia… producing Nitrites… which exert a chlorine demand… which decreases the residual… which allows microbes to flourish… to produce more nitrites… which continues the spiral… until your residual is gone! aka … “feeding the beast”
Operational Philosophy • It is my experience that the best operational plans are developed directly with the operators in the plants and distribution system. • I strongly encourage that operators be involved in the development of the plan.
Historic Data Review • Compile available WQ data from previous years: • chlorine levels leaving the plant • Chlorine levels at key points in the DS (entry, mid, distant) • Positive total coliform and E. coli data • Water temperature • Compile key hydraulic data (water age) • Total system delivery (MGD) • For key water tanks, % daily variation in water levels • System water age tracer test results (if available)
Develop system chlorine demand curves (weekly, all year long) • Capture plant effluent water (6-10 containers) • Store in dark, water-temperature conditions (submerge in filter, bottles in aluminum foil) • Analyze after 1, 2, 3, 5, 7, 10 days • Plot up data (note water temperature on graph) • Correlate any significant changes with WQ of influent water (Turbidity, algae, TOC, others) • Record benchmark demand (5 or 7 day) on a running total graphic leading up to nitrification period.
Develop monitoring protocol • At key locations, monitor chloramine levels (weekly is minimal for key sites) • All tanks should be regularly monitored • Minimum monthly if no problems are evident • Minimum weekly if chloramine levels start to drop below benchmarks • Make sure to sample during “tank draining” cycle, or both tank drain/tank fill cycle to define nitrification conditions in tank. • Consider additional analytical capabilities: • Nitrite • HPC • “available” ammonia
Setting Benchmarks (based on data review) • Establish “normal” variations not requiring action (such as, chloramine level not less than 1.5mg/l at far reaches of DS) • Establish level 1 action benchmark (such as chloramine demand below 1.5 mg/l. This will drive initial prevention actions • Establish level 2 action benchmark (such as chloramine level less than 1.0 mg/l). This will drive a more aggressive set of actions • Establish level 3 (such as 0.5 mg/l chloramine), which will drive the most aggressive actions (such as tank draining/refill, free-chlorine burn, etc.)
Develop Action Plans • The action plan needs to be utility-specific, and in some instances “tank specific”, but the following elements are typical: • Minimize excess ammonia feed (at all times) • Increase chloramine levels leaving the plant • Manage water age (maximize “safe” tank turnover rates, flush at extremities, drain tanks when necessary, transfer between pressure zones) • Booster chlorination, chloramination • Free chlorine burn • Others…(tank depth profile monitoring, tank mixing, water line replacement programs, etc.)
Post-event evaluation • If events are seasonal, schedule an annual review of all data shortly after the season is over. Review with staff: • What went well, what went poorly • Revisions to benchmarks • Improvements to action plans • Long-term improvements needed (Capital Improvement Plan) • Revise plan for next season
References • To be developed. If you have any favorites on this topic, let me know. The target audience is water utility plant managers and operators.
Feedback to Steve • This PP is under development (and probably will remain that way!) • All suggestions and corrections are openly solicited, and you are encouraged to share this PP with others for feedback. Always reference the version you are commenting on. • A “sample” Nitrification plan has been developed as a guide. You can use it as a template (but not required). • A Excel spreadsheet is available for generating the graphic. • Examples of typical nitrification plans would be great, especially examples of data analysis and tank-specific action plans • Thanks! Steve shubbs@coronaenv.com