Download
1 / 27
270 likes | 354 Views
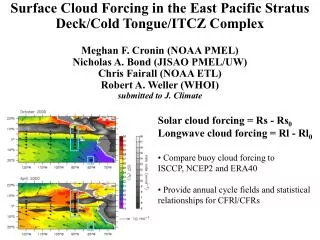
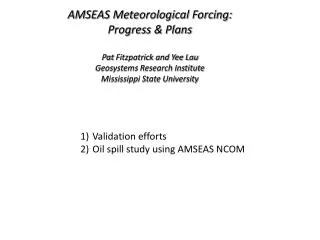
AMSEAS Meteorological Forcing: Progress & Plans Pat Fitzpatrick and Yee Lau Geosystems Research Institute Mississippi State University. Validation efforts Oil spill study using AMSEAS NCOM. Validation effort. Wind Validation, NCOM versus 37 buoys, June 20-July 10, 2010.

E N D
AMSEAS Meteorological Forcing: Progress & Plans Pat Fitzpatrick and Yee Lau Geosystems Research Institute Mississippi State University • Validation efforts • Oil spill study using AMSEAS NCOM
Wind Validation, NCOM versus 37 buoys, June 20-July 10, 2010 Wind Validation, NCOM versus 23 buoys, Dec. 1, 2010-Jan. 15, 2011 Most errors less than range extremes shown Wind converted from wind stress using drag coefficient of 0.001 Buoys adjusted to 1-minute average winds, 10-meter height
Future plans • Document general error trends • Provide details on vector correlation methodology • Document typical case studies • Detailed tables for CMAN versus offshore buoys; other geographical differences?
Model description • Lagrangian particle tracker with random walk diffusion • Input consisted • latitude and longitude parcel positions in the oil-contaminated area • wind • current • array of pseudo-random numbers (from Mersenne Twister algorithm, • initial seed from machine noise) • new parcels were released damaged Macondo rig location at each timestep • Twenty-five parcels were released at each position, and when combined • with a 10 m2s-1 diffusion coefficient, resulted in a natural trajectory spread with time • Initial positions based interpretation on • NASA MODIS • SAR imagery from http://www.cstars.miami.edu • NOAA/NESDIS Satellite Analysis Branch (SAB) experimental surface oil analysis • products at http://www.ssd.noaa.gov/PS/MPS/deepwater.html • iv. NOAA’s Office of Response and Restoration oil trajectory maps • at http://response.restoration.noaa.gov • Parcels advectedat 80% of the ocean current speed and at 3% of the wind speed. • Bilinear interpolation of wind and curent applied from model grid to parcel location.
Oil spill simulation from 6/20/10-7/10/10 Using AMSEAS NCOM data Note inshore movement of oil starting late June
Elevated waterfrom Alex Elevated waterfrom low
Future work High Frequency Radar ocean currents Scatterometer winds (ASCAT) 10:10am CDT 29 June 2010 • Seeking collaborating authors for paper on cyclones’ impact on oil spill • NCOM currents analysis • NCOM water elevation analysis • New oil spill run for whole period, current and wind weights optimized from 3DVAR • Analysis of weather terms • Overall goal: fate and transport analysis
Questions? HAPPYMARDI GRAS!