Download
1 / 58
580 likes | 709 Views
Explore the estimated number of individuals living with HIV in different regions, the global response to the epidemic, and surveillance strategies. Discover key data sources and WHO strategies for HIV/AIDS surveillance. Understand the patterns of HIV transmission and the impact on various populations worldwide.

E N D
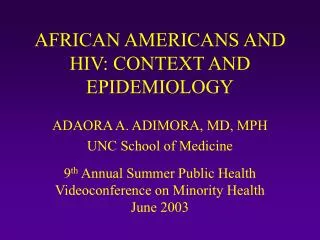
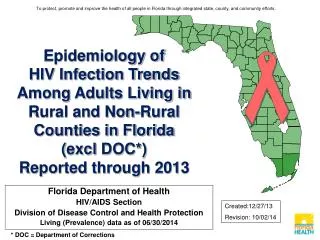
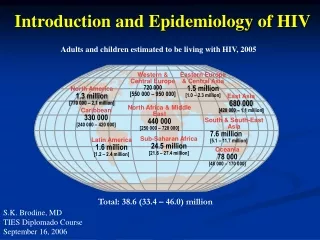
Introduction and Epidemiology of HIV Adults and children estimated to be living with HIV, 2005 Western & Central Europe 720 000 [550 000 – 950 000] Eastern Europe & Central Asia 1.5 million [1.0 – 2.3 million] North America 1.3 million [770 000 – 2.1 million] East Asia 680 000 [420 000 – 1.1 million] North Africa & Middle East 440 000 [250 000 – 720 000] Caribbean 330 000 [240 000 – 420 000] South & South-East Asia 7.6 million [5.1 – 11.7 million] Sub-Saharan Africa 24.5 million [21.6 – 27.4 million] Latin America 1.6 million [1.2 – 2.4 million] S.K. Brodine, MD TIES Diplomado Course September 16, 2006 Oceania 78 000 [48 000 – 170 000] Total: 38.6 (33.4 – 46.0) million
Response to the HIV Epidemic – • Global response tragically delayed • Substantial funding and activity level currently • Growing recognition of relationship of poverty, gender issues, violence Award Winning Film, 2005
The President’s Emergency Plan for AIDS Relief (PEPFAR) • Prevent 7 million new infections • Provide treatment to 2 million HIV-infected people • Care for 10 million people infected and affected by HIV/AIDS including orphans and vulnerable children PEPFAR Targets!!
9000 • Data include: • International donors, domestic spending (including public spending and out-of-pocket expenditures) • International Foundations and Global Fund included from 2003 onwards, PEPFAR included from 2004 onwards • * Projections based on previous pledges and commitments (range of the estimation: US$7.5 to US$8.5 billion). Signing of Declaration of Commitment on HIV/AIDS 8297* 8000 7000 6000 5000 US$ million 4000 3000 2000 1623 1000 292 0 1996 1997 1998 1999 2000 2001 2002 2003 2004 2005 3.8 Estimated total annual resources available for AIDS, 1996‒2005
HIV Epidemiology: Overview • Second Generation Surveillance • Global Patterns • Sub-Saharan Africa • Latin America • U.S. • Modes of Transmission • Overview • Sexual Transmission
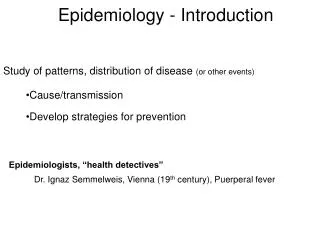
Principles of HIV Surveillance • Second Generation Surveillance: Strengthened systems aim to concentrate resources where they will yield the most useful information to reduce the spread of HIV: Tailored to the Country • Classify the epidemic into different states: Low, Concentrated, or Generalized • Choice of populations for surveillance will vary from epidemic to epidemic • Surveillance should include biomedical and behavioral data
Sources of Data in Second Generation Surveillance Biologic Surveillance • Sentinel surveillance in sub-populations (pregnant women, STI patients, IDUs, Sex workers, MSM) • Regular HIV screening of donated blood • Regular HIV screening of occupational cohorts • HIV screening of specimens taken in special population surveys Behavioral Surveillance • Repeat cross-sectional surveys in the general population and defined sub-populations
WHO Strategies for HIV/AIDS Surveillance • Active serosurveillance of HIV infections through sentinel populations • Closely managed by surveillance team • Collects descriptive epidemiology • Highly sensitive and specific case definition possible (e.g., HIV sero-status) • Passive case notification surveillance of illnesses meeting the WHO AIDS case definition criteria • Under-diagnosis • Under-reporting • Reporting delays • Different case definitions
Surveillance: HIV vs AIDS HIV* AIDS Number Percent Number Percent Age <13 2,134 2 8,908 1 13-19 5,580 4 4,061 1 20-29 45,357 33 128,727 17 30-39 53,269 39 345,824 45 40-49 23,627 17 202,901 26 50+ 8,044 6 84,045 11 138,011 774,466 • HIV infection or AIDS Reported through 2000, United States. • Data from 36 areas with confidential HIV infection surveillance.
Identifying Early HIV infection • Single sample STARHS (detuned) or BED-EIA • Can estimate HIV incidence; transmission dynamics • Use in: • Public Health: rapid contact investigation; identifying high risk populations; evaluation of prevention programs • Clinical trials: calculate sample sizes • Preliminary data, SD County VCT program; 1997-2000 • 26% of HIV and MSM are early HIV infection
A global view of HIV infection 38.6 million people [range: 33.4-46.0 million] living with HIV in 2005
HIV prevalence (%) in adults in Africa, 2005 2.5 Generalized epidemic in Sub-Saharan Africa! Across educational, socio-economic, professional groups Primarily in 15-49 year old (productive!) ages High risk populations: mobile, migratory or displaced military Contributing factors Cultural practices, including traditional healers Conflict, instability Poor literacy, including medical literacy
Angola as a Case Study in War as a Protective Factor for HIV Transmission HIVCongo ~5* - 35% HIV Angola ~6%* HIV Zambia 22%* HIV Namibia 23%* HIV Botswana 39%*
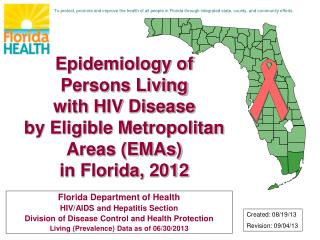
South African National HIV Prevalence • Household survey in age 2 and • Older • 15,851 participants • DBS used; able to assay incidence Prevalence by Province ** Incidence data of 2.1% (181 + BED) Prevalence by age and gender Matched antenatal data, when African women only
Regional HIV and AIDS statistics and features, 2003 and 2005 REGION Adults (15+) and children living with HIV Adults (15+) and children newly infected with HIV Adult (15-49) prevalence (%) Adult (15+) and child deaths due to AIDS 2005 2003 2005 2003 2005 2003 2005 2003 Sub-Saharan Africa 24.5 million [21.6‒27.4 million] 23.5 million [20.8‒26.3 million] 2.7 million [2.3‒3.1 million] 2.6 million [2.3‒3.0 million] 6.1 [5.4‒6.8] 6.2 [5.5‒7.0] 2.0 million [1.7‒2.3 million] 1.9 million [1.7‒2.3 million] North Africa and Middle East 440 000 [250 000‒720 000] 380 000 [220 000‒620 000] 64 000 [38 000‒210 000] 54 000 [31 000‒150 000] 0.2 [0.1‒0.4] 0.2 [0.1‒0.3] 37 000 [20 000‒62 000] 34 000 [18 000‒57 000] Asia 8.3 million [5.7‒12.5 million] 7.6 million [5.2‒11.3 million] 930 000 [620 000‒2.4 million] 860 000 [560 000‒2.3 million] 0.4 [0.3‒0.6] 0.4 [0.2‒0.6] 600 000 [400 000‒850 000] 500 000 [340 000‒710 000] Oceania 78 000 [48 000‒170 000] 66 000 [41 000‒140 000] 7200 [3500‒55 000] 9000 [4300-69 000] 0.3 [0.2‒0.8] 0.3 [0.2‒0.7] 3400 [1900‒5500] 2300 [1300‒3600] Latin America 1.6 million [1.2‒2.4 million] 1.4 million [1.1‒2.0 million] 140 000 [100 000‒420 000] 130 000 [95 000‒310 000] 0.5 [0.4‒1.2] 0.5 [0.4‒0.7] 59 000 [47 000‒76 000] 51 000 [40 000‒67 000] Caribbean 330 000 [240 000‒420 000] 310 000 [230 000‒400 000] 37 000 [26 000‒54 000] 34 000 [24 000‒47 000] 1.6 [1.1‒2.2] 1.5 [1.1‒2.0] 27 000 [19 000‒36 000] 28 000 [19 000‒38 000] Eastern Europe and Central Asia 1.5 million [1.0‒2.3 million] 1.1 million [790 000‒1.7 million] 220 000 [150 000‒650 000] 160 000 [110 000‒440 000] 0.8 [0.6‒1.4] 0.6 [0.4‒1.0] 53 000 [36 000‒75 000] 28 000 [19 000‒39 000] North America, Western and Central Europe 2.0 million [1.4‒2.9 million] 1.8 million [1.3‒2.7 million] 65 000 [52 000‒98 000] 65 000 [52 000‒98 000] 0.5 [0.4‒0.7] 0.5 [0.3‒0.6] 30 000 [24 000‒45 000] 30 000 [24 000‒45 000] TOTAL 38.6 million [33.4‒46.0 million] 36.2 million [31.4‒42.9 million] 4.1 million [3.4‒6.2 million] 3.9 million [3.3‒5.8 million] 1.0 [0.9‒1.2] 1.0 [0.8‒1.2] 2.8 million [2.4‒3.3 million] 2.6 million [2.2‒3.1 million]
HIV prevalence in Latin America and the Caribbean Adults (15–49) rate (%) Mexico ranks 23rd in Latin America and the Caribbean. and 77th in the world. However, it ranks 2nd, just after Brazil on the total number of cummulated AIDS cases Source: UNAIDS. 2004 Report on the global AIDS epidemic, Geneva, 2004
Estimated number of people living with HIV in Latin America and Caribbean, 1986–2005 2.5 Million 2.0 1.5 Number of people living with HIV 1.0 0.5 0.0 1985 1990 1995 2000 2005 Year
HIV prevalence (%) in adults in Latin America and the Caribbean, 2005 2.13
Heterosexual Others IDU MSM AIDS casesby exposure category and sub region Cumulative AIDS cases through December 2000 South Cone Central America Mexico Caribbean North America Brazil Source: OPS. Vigilancia del SIDA en las Américas (Informe Bianual), abril 2001.
Cumulative AIDS cases in Mexico by Exposure category and gender Reported through December 31,2004 WOMEN MEN 72.2% Source: CENSIDA based in National AIDS Cases Registry.
Cumulative AIDS Incidence, Mexican States (June 2006)* National Average U.S. –Mexico BorderStates * * per 100,000. Source: Registro Nacional de Casos de SIDA, CONASIDA
HIV prevalence in selected populations: Mexico-U.S. Border States Sources: CENSIDA, CA State Office of AIDS; Patterson et al, 2006; Strathdee et al, in prep; Viani et al, 2006
US AIDS Trends • Trends in new AIDS cases; • trends in AIDS deaths B. People alive with AIDS • Federal spending (millions of $, • for AIDS care, prevention, research)
Death Lysis of cell Cell transformation Classical severe disease Cell dysfunction Moderate severity Viral multiplication w/o visible change Infection w/o illness Exposure w/o infection Exposure w/o cell entry Iceberg Concept of Infection
HIV Transmission Among Black Women, North Carolina 2004 • Case Control Study Design • Risk behaviors in both HIV neg and • positives • 71% HIV +, infected by steady • partner • Primary concern is food and shelter MMWR: Feb 4, 2005
Hispanic AIDS Cases by Place of Birth, San Diego County 69% 56% 53% 47% 44% 31% San Diego County, Office of AIDS, 2004
Convergence Model of Disease Causation More complex than the Host-Agent-Environment model
“Microbe” Genomic Factors: Diversity of HIV Subtypes (Strains) A/GIbNG A/ECM240 A D B C F J Gag H G .10
Human Genomic Factors: CCR5 Receptor Mutant and HIV ‘Resistance’
Biologic Factors in Sexual Transmission of HIV Transmission more likely with: • High viral loads (including primary HIV infection) • Coinfection with other STDs • Trauma/exposure to blood • Anal > Vaginal > Oral • Lack of Circumcision
Viral Load and Heterosexual Transmission of HIV • 415 discordant couples, Uganda • Follow-up x 30 months • 22% of cohort seroconverted • Viral load chief predictor (rare event < 1500 copies) • Female to Male Transmission = Male to Female Quinn, TC, et al. NEJM 342:921-929. 2000
Transmission Rates Among Discordant Couples by Gender and Viral Load Quinn, T. et al. NEJM 342:921. 2000.