Download

1 / 31
320 likes | 344 Views
Explore the fundamentals of motion in one dimension, including scalar vs. vector quantities, kinematic equations, graphical interpretation, and free fall motion. Understand the difference between speed and velocity, distance and displacement, and the concept of acceleration in physics.

E N D
Unit 2 Motion • Relative motion • Quantifying Motion • Scalar vs. Vector • Speed vs. Velocity • Distance vs. Displacement • Acceleration • Kinematic equations • Graphical interpretation of motion • Free fall motion
Classification of Physics Quantities Vector - quantity with both magnitude (size) and direction Scalar - quantity with magnitude only Vectors: • Displacement • Velocity • Acceleration • Momentum • Force Scalars: • Distance • Speed • Time • Mass • Energy
Sign Conventions • Positive sign • Travel East, to the right or travel North, upwards • Negative sign • Travel West, to the left or travel South, downwards
Quantity . . . Unit (symbol) Displacement & Distance . . . meter (m) Time . . . second (s) Velocity & Speed . . . (m/s) Acceleration . . . (m/s2) Mass . . . kilogram (kg) Momentum . . . (kg·m/s) Force . . .Newton (N) Energy . . . Joule (J) Units Units are not the same as quantities!
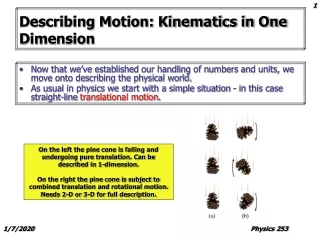
Kinematics – branch of physics; study of motion Distance (d) – how far you have traveled, regardless of direction(length of the path traveled) Displacement (d) – where you are in relation to where you started, includes direction (length and direction from start to finish) Kinematics definitions
You drive the path, and your odometer goes up by 8 miles (your distance). Your displacement is the shorter directed distance from start to stop (green arrow). What if you drove in a circle? Distance vs. Displacement start stop
Speed, Velocity, & Acceleration • Speed (v) – how fast you go • Velocity (v) – how fast and which way; the rate at which displacement changes • Acceleration (a) – how fast you speed up, slow down, or change direction; the rate at which velocity changes
Speed vs. Velocity • Speed is a scalar (it does not consider direction)Ex: v = 20 mph • Speed is often the magnitude of velocity. • Velocity is a vector (it considers both speed and direction). Ex: v = 20 mph at 15 south of west
vf = vi + at • vavg = (vi + vf)/2 • d = vit + ½at2 • vf2 = vi2+2ad • a = ∆v/t • v = d/t Kinematics Formula Summary For 1-D motion with constant acceleration:
Types of Motion Graphs • d-t displacement vs. time • v-t velocity vs. time • a-t acceleration vs. time
d-t Graph with Constant Speed • The slope of a distance-time graph represents velocity. • A constant slope means a constant velocity. • The slope can be positive, negative , or zero.
Distance-Time Graph Positive Slope= Positive Velocity Zero Slope = Zero Velocity Distance Negative Slope= Negative Velocity Time
d-t Graph with Changing Velocity This curve shows a changing slope which means a changing velocity
Finding the Velocity The slope of the tangent line to the curve represents the instantaneous velocity
F D E B C A
Which one(s) are motionless? Which one(s) have a constant velocity? Which one(s) are accelerating? Which one(s) return to their starting position? Which one(s) have a positive velocity? Which one(s) meet?
v-t Graph with Constant Acceleration • The slope of a speed time graph represents acceleration. • A constant slope implies a constant acceleration. • The slope can be positive, negative, or zero
Velocity-Time Graph Positive Slope= Positive Acceleration Zero Slope = Zero Acceleration Velocity Negative Slope= Negative Acceleration Time
v-t Graph Displacements • The area under the curve to the t-axis represents the displacement of the object. • The area can be found using simple geometry formulas. • The area may be “negative” if the curve lies under the t-axis.
v-t Graph Displacements Area = Length x Width Velocity Displacement Time
v-t Graph Displacements Area = 1/2 Base x Height Velocity Disp. Time
Which one(s) are motionless? Which one(s) have a constant velocity? Which one(s) are accelerating? Which one(s) change their motion? Which one(s) have a positive velocity? Which one(s) displace the least?
a-t Graph with Constant Acceleration • The slope of an acceleration-time graph will be zero in this course. • A zero slope implies a constant acceleration. • The area under the curve represents the change in velocity of the object.
a-t Graph Change in Velocities Area = Length x Width Acceleration Dv Time
Summary • d-t Graph • Slope represents velocity • v-t Graph • Slope represents acceleration • Area under curve represents displacement • a-t Graph • Area under curve represents Dv