Download
1 / 13
130 likes | 210 Views
Discover the intriguing phenomenon of Simpson's Paradox through AS Maths results comparing 2006 and 2007, with insights from Leics County Cricket batting averages. Learn from historical examples by E.H. Simpson and Karl Pearson. Find out more about interpreting interaction in contingency tables and its relevance in decision-making. Explore the complexities of data analysis and statistical relationships. Uncover an interesting fact about the probability of encountering Simpson's Paradox in a 2x2 contingency table. Reflect on the question of improvement in performance and evaluating statistical data objectively.

E N D
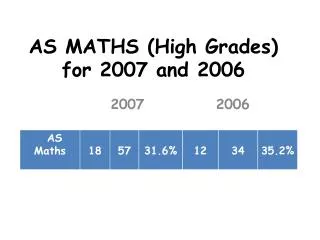
AS MATHS (High Grades) for 2007 and 2006 2007 2006
AS MATHS (High Grades) for 2007 and 2006 2007 2006
LEICS COUNTY CRICKET2010/11 BATTING AVERAGES 2010 and 2011 combined
AS Results Batting Averages Another Example
E.H.Simpson “The interpretation of interaction in contingency tables” (1951)Karl Pearson (1899)
“Impossible” by Julian HavilAlan Crowe – Simpson’s ParadoxYou Tube – Simpson’s Paradox
Interesting Fact! The probability that Simpson’s Paradox will apply within any 2x2 contingency table is 1/60.
Which batsman was better?Did my AS Maths results really improve?