Download
1 / 12
120 likes | 127 Views
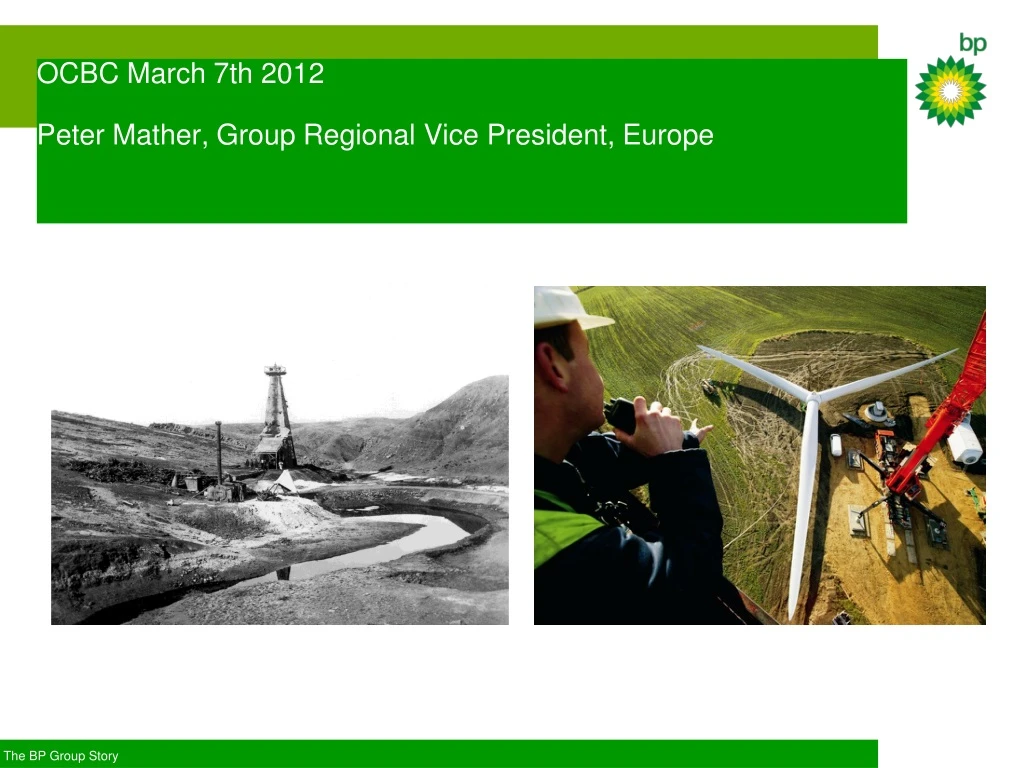
OCBC March 7th 2012 Peter Mather, Group Regional Vice President, Europe. Today’s agenda. The Outlook for Energy The Factors behind Energy Policy BP – our own and the Industry’s Challenges Discussion. Non-OECD economies continue to drive consumption growth.

E N D
OCBC March 7th 2012Peter Mather, Group Regional Vice President, Europe
Today’s agenda • The Outlook for Energy • The Factors behind Energy Policy • BP – our own and the Industry’s Challenges • Discussion
significant resources • infrastructure • alternatives • economic growth • urbanisation • efficiency Supply Challenges Demand Growth Energy Policy & Technology Environmental Constraints Security of Supply • import dependence • resource competition • local pollution • climate change Four key factors in our energy future
External Context • Gulf of Mexico incident • - BP Reputation – focus on safety, trust, value • - Industry Reputation • Oil prices • Global Economy • Geopolitics • Political Imperatives • - Energy Security • - Affordability • - Climate Change
BP has seen change before 1972-75: Iraq, Iran, Kuwait nationalised 1933: Kuwait Oil Company formed (50/50 BP/Gulf) 1998: Merger with Amoco 2003 TNK-BP 1951: Temporarily nationalised in Iran; diluted to 40% 1908: Masjid-i-Suleiman discovery in Iran 1978: Sohio fully consolidated (100% 1987) 1968: Prudhoe Bay discovery 1970: Forties Production (mboe/d) North Sea & Alaska growth 1911: Iran starts producing 1927: Iraq Kirkuk discovery Sohio brings entry into US downstream Acquisitions: 1998 Amoco 2000 Arco 2002 Veba European refining expansion: by 1973 interests in 20 refineries 1975: Kuwait refinery nationalised 1951: Iran refineries nationalised Throughput (kbd) 1955: Kwinana commissioned 1938: Abadan the world’s largest refinery 1913: Iran Abadan refinery starts-up
Moving BP Forward Our 10 - point plan What you can expect What you can expect What you can measure Relentless focus on safety and managing risk Play to our strengths Stronger and more focused Simpler and more standardized More visibility and transparency to value • Active portfolio management to continue • New upstream projects onstream with unit operating cash margins double the 2011 average(1) • Generate around 50% more annually in operating cash flow by 2014 versus 2011 at $100/bbl(2) • Half of incremental operating cash for re-investment, half for other purposes including distributions • Strong balance sheet (1) Assuming a constant $100/bbl oil price and excluding TNK-BP (2) See Statement of Assumptions under Cautionary Statement