Download

1 / 75
750 likes | 771 Views
ELASTICITY. Principles of Microeconomic Theory, ECO 284 John Eastwood CBA 247 523-7353 e-mail address: John.Eastwood@nau.edu. Learning Objectives. Define and calculate the price elasticity of demand Explain what determines the price elasticity of demand

E N D
ELASTICITY • Principles of Microeconomic Theory, ECO 284 • John Eastwood • CBA 247 • 523-7353 • e-mail address: John.Eastwood@nau.edu
Learning Objectives • Define and calculate the price elasticity of demand • Explain what determines the price elasticity of demand • Use the price elasticity to determine whether a price change will increase or decrease total revenue
Learning Objectives (cont.) • Define, calculate and interpret the income elasticity of demand • Define, calculate and interpret the cross-price elasticity of demand • Define and calculate the elasticity of supply • Use elasticities to analyze tax incidence.
Learning Objectives • Define and calculate the price elasticity of demand • Explain what determines the price elasticity of demand • Use the price elasticity to determine whether a price change will increase or decrease total revenue
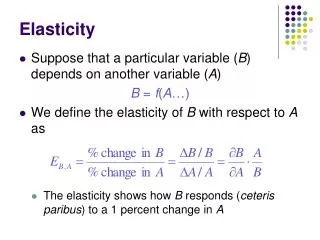
Elasticity • Elasticity measures the response of one variable to changes in some other variable. • Civil Engineers need to know the elasticity of construction materials. • Economists need to know the elasticity of quantities demanded (and supplied).
Elasticity of Demand • How does a firm go about determining the price at which they should sell their product in order to maximize profit? • Profit = total revenue – total cost = TR - TC • Total Revenue = Price ´ Quantity =PQ • How does the government determine the tax rate that will maximize tax revenue?
Price Elasticity of Demand, ed ed measures the responsiveness of quantity demanded of a product to a change in its own price, ceteris paribus. ed = (percentage change in Qd) divided by (the percentage change in the Px)
Example • Assume that the price of crude oil has increased by 100%, and that the quantity demanded has fallen by 10% ed = -10% / 100% = -0.1 • For every 1% increase in price, the quantity demanded fell by 0.1%
Computing Elasticity Using the “Arc Formula” • where P1 represents the first price, P2 the second price, and Q1 and Q2 are the respective quantities demanded. • Elasticity is dimensionless (units divide out).
Arc Formula Notation • Some people prefer to write delta for change, and “overbar” for average.
Calculating Elasticity • The changes in price and quantity are expressed as percentages of the average price and average quantity. • Avoids having two values for the price elasticity of demand • ed is negative; its sign is ignored
Calculating the Elasticity of Demand Original point 410 Price (dollars per chip) 400 390 Da 36 40 44 Quantity (millions of chips per year)
Calculating the Elasticity of Demand Original point 410 Price (dollars per chip) 400 New point 390 Da 36 40 44 Quantity (millions of chips per year)
= $20 = 8 Calculating the Elasticity of Demand Original point 410 Price (dollars per chip) 400 New point 390 Da 36 40 44 Quantity (millions of chips per year)
= $20 = 8 Original point 410 Price (dollars per chip) 400 Pave = $400 New point 390 Da 36 40 44 Quantity (millions of chips per year)
= $20 = 8 Calculating the Elasticity of Demand Original point 410 ed = ? Price (dollars per chip) 400 Pave = $400 New point Qave = 40 390 Da 36 40 44 Quantity (millions of chips per year)
= $20 = 8 Calculating the Elasticity of Demand Original point 410 ed = 20/5 = 4 Price (dollars per chip) 400 Pave = $400 New point Qave = 40 390 Da 36 40 44 Quantity (millions of chips per year)
Example -- Crude Oil • Assume P1 = $15/bbl, Q1 = 105 bbl/day, and that P2 = $25/bbl, Q2 = 95 bbl/day • Calculate ed using this formula:
Answer: • For every 1% increase in price, Qd fell 0.2%.
Elasticity and Slope ed and slope are inversely related.
Discussing ed • Note that ed is always negative (or zero) because of the law of demand. • However, when discussing the value of ed , economists almost always use the absolute value. Using | ed |, a larger value means greater elasticity.
Elastic Demand, | ed |>1 • If the percentage change in quantity demanded is greater than the percentage change in price, demand is said to be price elastic. • The demand for luxury goods tends to be price elastic. • Examples – see page 99 of McEachern.
Inelastic Demand, | ed |< 1 • If the percentage change in quantity demanded is smaller than the percentage change in price, demand is said to be price inelastic. • The demand for necessities tends to be price inelastic.
Perfectly Elastic D, ed = infinity • If quantity demanded drops to zero in response to any price increase, demand is said to be perfectly elastic. • This corresponds to a horizontal demand curve. • Sounds unlikely, doesn’t it? • Example: Demand for a small country’s exports
Inelastic and Elastic Demand Price Elasticity = 12 D3 Perfectly Elastic 6 Quantity
Perfectly Inelastic D, ed =0 • If quantity demanded is completely unresponsive to a change in price, demand is said to be perfectly inelastic. • This corresponds to a vertical demand curve. • Can you think of a vertical demand curve?
Inelastic and Elastic Demand D1 Price Elasticity = 0 12 Perfectly Inelastic 6 Quantity
Unit Elastic D, | ed |= 1 • If the percentage change in quantity just equals the percentage change in price, demand is said to be unit elastic. • While there are many goods that could be unit elastic, there aren’t any we can identify without statistical evidence. • Example:
Inelastic and Elastic Demand Price Elasticity = 1 12 Unit Elasticity 6 D2 Quantity 1 2 3
ed and Total Revenue (TR) • Note that TR = P times Q = PQ. • Will a change in price raise or lower total revenue? • It all depends on the price elasticity of demand!
When Demand is Elastic, P and TR vary inversely. • Since | ed | > 1, the percentage change in Qd is greater than the percentage change in P. • If P rises by, say, 1%, Qd will fall by more than 1%. • Therefore, if price is increased, total revenue will decrease. • If price is reduced, then TR will rise.
When Demand is Inelastic, P and TR vary directly. • Since | ed | < 1, the percentage change in Qd is smaller than the percentage change in P. • If P rises by, say, 1%, Qd will fall by less than 1%. • Therefore, if price is increased, total revenue will increase. • If price is reduced, then TR will fall.
When Demand is Unit Elastic, TR does not change. • Since | ed | = 1, the percentage change in Qd equals the percentage change in P. • If P rises by, say, 1%, Qd will fall by exactly 1%. • Therefore, if price is increased, total revenue will stay the same. • If price is reduced, TR will not change.
Some Real-World Price Elasticities of Demand Good or Service Elasticity Elastic Demand Metals 1.52 Electrical engineering products 1.30 Mechanical engineering products 1.30 Furniture 1.26 Motor vehicles 1.14 Instrument engineering products 1.10 Professional services 1.09 Transportation services 1.03 Inelastic Demand Gas, electricity, and water 0.92 Oil 0.91 Chemicals 0.89 Beverages (all types) 0.78 Clothing 0.64 Tobacco 0.61 Banking and insurance services 0.56 Housing services 0.55 Agricultural and fish products 0.42 Books, magazines, and newspapers 0.34 Food 0.12
Example: Demand for Oil and Total Revenue • Assume demand is p = 60 - q • TR = price x quantity =PQ • Substituting 60-q for p gives, TR=(60-q)q • Multiply through by q to get an equation for TR, TR = 60q - q2 • TR will graph as a parabola. • Let’s calculate TR and graph it with D.
Linear Demand and Point Elasticity • ed can be illustrated with geometry. • With a linear D, the slope is constant. • We don’t need an arc to get the slope. • Elasticity is inversely related to slope.
ed Using Line Segments • The formula for ed may be rewritten in terms of the length of line segments. • O is the origin, T is the x-intercept, and M is a point between O and T.
Elasticity at the Midpoint • | ed | =MT/OM for any linear demand curve. • If M is the middle, then MT=OM. • ed = | -1| = 1 • Unit Elastic at the midpoint.
Elasticity at Higher Prices If M is left of the middle, then MT>OM. | ed | =MT/OM. | ed | > 1 Demand is elastic at higher prices.
Elasticity at Lower Prices If M is right of the middle, then MT<OM. | ed | =MT/OM. | ed | < 1 Demand is inelastic at lower prices.
Two Extremes • At the point where the demand curve intercepts the vertical axis, ed is infinite or perfectly elastic. • At the point where the demand curve intercepts the horizontal axis, ed = 0, that is, demand is perfectly inelastic.
Determinants of ed • Number of substitutes • quality • availability • Budget proportion • Time • to respond • to consume
Other Elasticity Concepts • Income Elasticity of Demand, ey • Cross Price Elasticity of Demand, ex,z • Price Elasticity of Supply, es
Income Elasticity of Demand, ey • ey measures the change in demand for a good (X) in response to a change in income (Y), ceteris paribus. • If ey > 0, X is a normal good. • If ey < 0, X is an inferior good.
Computing Income Elasticity • With Q1 and Q2, find the change in quantity and the average quantity . • Given Y1 and Y2, find the change in income and the average income.
Example Computations • Median annual family income rose from $39,000 to $41,000 per year. • The demand for electricity rose from 79,000 GWh to 81,000 GWh. • Normal or inferior?