Download
1 / 20
200 likes | 307 Views
Special observations, developments, and specific needs for AMMA project's satellite rainfall estimation and validation. Utilizing specific algorithms and products to meet multidisciplinary requirements with various time and space scales.

E N D
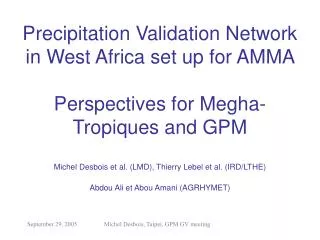
satellite rainfall estimation and validation in the frame of AMMA (the African Monsoon Multidisciplinary Analysis) Michel Desbois*, Franck Chopin*, Isabelle Jobard*, Abdou Ali**, Abou Amani**, Thierry Lebel***, and the EU Precipamma Group *LMD-IPSL-CNRS **Agrhymet Center, Niamey, Niger ***LTHE-IRD, Grenoble IPWG, M. Desbois, AMMA, Melbourne, October 2006
Special observations and developments for AMMA AMMA observations are covering different time periods : Long term (10 years and more), Extended (3 years), Special Observing Periods (in 2006). • Observations include : • operational networks (meteorology, hydrology, aerosols), • enhanced networks (radiosoundings) • Specific measurements in supersites • Aircrafts and ships observations during SOP’s • Specific collection and processing of satellite observations (AMMASAT) Specific databases are constructed to collect and distribute the data to the project partners, without operational objectives. IPWG, M. Desbois, AMMA, Melbourne, October 2006
Specific needs of AMMA : multidisciplinary Requirements of precipitation products from different communities : Hydrologists, Surface water budget analysts and modelists (SVATs), Agronomists, Climate modelists, Mesoscale modelists, Intraseasonal variability analysts, Various impacts people, for example health impacts specialists Lead to requirements for time and space scales ranging from 10 days, 1 X 1°, to hours, 10 x 10 km (continuously). Not accounting for instantaneous estimates needed for assimilation in forecast models IPWG, M. Desbois, AMMA, Melbourne, October 2006
Requirements for satellite precipitation estimations during AMMA Use the best time resolution available in that area : 15 minutes with Meteosat Second Generation, Ensure the capablity of this satellite to detect properly rainfall areas, Ensure the consistency of rainfall measured at different time-space scales Ensure the consistency with a reference product at large space-time scales. Provide estimations of errors at the different scales retrieved IPWG, M. Desbois, AMMA, Melbourne, October 2006
Development and validation of specific algorithms (precipamma group) • European group (LMD/CNRS Paris, CNR Bologna + Ibimet, Univ. Of Bonn, Tamsat Univ. Reading) • Tests on year 2004 (validation data provided by AGRHYMET and IRD) • First results show satisfactory results of the LMD method based on MSG (EPSAT-SG) • real time application of EPSAT-SG trained on previous years on rainy season 2006 (AMMA SOP) • Methods will be re-runned with complete data sets and validated against AMMA-SOP data (including radar data). New intercomparison exercises planned. IPWG, M. Desbois, AMMA, Melbourne, October 2006
EPSAT-SG scheme(Estimation des Pluies par SATellite – Seconde Génération) MSG IR Channels SRTM Digital Elevation Model Neural Network 2A25 TRMM precipitation Radar data Equation 1 Rainfall probability images (Pr) GPCP1dd rainfall images (Igpcp) Ais a disc of about 125kms radius cA is the centre of A dis the considered day T is the period [d-15days,d+15days] dt1 corresponds to 1 day dt2 corresponds to 15 minute da corresponds to 1 MSG pixel Equation 1 Potential rainfall intensity images (Ip) Equation 2 Equation 2 Estimated Rainfall Intensity at time t during day d and position a: Final product resolutions: Space resolution : 3 kms Time resolution : 15 minutes IPWG, M. Desbois, AMMA, Melbourne, October 2006 EPSAT-SG rainfall estimation (Ie)
Collocation between Pr image (2A25 TRMM data - red- ) and EPSAT-SG probability of rainfall -gray levels- IPWG, M. Desbois, AMMA, Melbourne, October 2006
Example of validation on 10 days periods, 1 degree x 1 degree Validation from krieged data : • Provided by IRD and AGRHYMET • Space resolutions : 0.5, 1 and 2.5 degrees • Time resolution : 10-day periods The validation datasets have been provided with an estimate of its uncertainty for each grid cell. More detailed data sets inside boxes Niger, Benin. IPWG, M. Desbois, AMMA, Melbourne, October 2006
Full space resolution Estimated Rainfall accumulation during the third 10-day period of August 2004 Validation (contd) 1°x1° rainfall accumulation from the IRD & AGRHYMET Raingauge Dataset during the third decade of August 2004 IPWG, M. Desbois, AMMA, Melbourne, October 2006
1°x1° Estimated Rainfall accumulation over validation area during the third 10-day period of August 2004 Validation (contd) 1°x1° rainfall accumulation from the IRD & AGRHYMET Raingauge Dataset during the third decade of August 2004 IPWG, M. Desbois, AMMA, Melbourne, October 2006
August 2004 Third Decade GPCP/krieged surface data EPSAT-SG/krieged surface data IPWG, M. Desbois, AMMA, Melbourne, October 2006
Comparison between GPCP 1dd and EPSAT-SG • Two validation studies have been done : • First one considers all the validation grid cells. • Second one takes into account only the 50% validation grid cells with the lowest krigging uncertainty. IPWG, M. Desbois, AMMA, Melbourne, October 2006
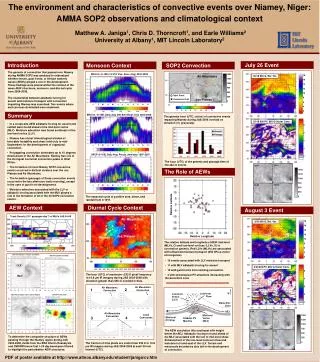
39 mm 23 mm 5 mm 17 mm Smaller time scalesEPSAT-SG and validation data for the square degrees of Niger and Benin, for different time resolutions rain estimation per event over the degree square of Niamey for 2004 Probability of rainfall, first decade August 2004, with surface measured rainfall of the full event IPWG, M. Desbois, AMMA, Melbourne, October 2006 R2 of the time series, for different accumulation times
Application to 2006 : Example of near real time estimation of rainfall from EPSAT-SG for the needs of the AMMA campaigns IPWG, M. Desbois, AMMA, Melbourne, October 2006 Accumulated over a 3 hours period
Application to 2006 : Examples of decadal estimates of rainfall, preliminary operational version of EPSAT-SG 60 mm 80 mm >150 mm >250 mm IPWG, M. Desbois, AMMA, Melbourne, October 2006
Application to 2006 : Examples of decadal estimates of rainfall, CPC product <100 mm 80 mm 200 mm >250 mm IPWG, M. Desbois, AMMA, Melbourne, October 2006
Application to 2006 : Examples of decadal estimates of rainfall, EPSAT-SG provisional product 1-10 July 1-10 August 11-20 July 11-20 August 21-31 August 21-31 July IPWG, M. Desbois, AMMA, Melbourne, October 2006
Latitude-time Hovmöller of the 2006 African Monsoon, at two different longitudes (2°E Niamey, 7.5°W Bamako) IPWG, M. Desbois, AMMA, Melbourne, October 2006
Conclusion and future developments • Epsat-SG gives results compatible with operational precip algorithms (CPC, GPCP) • Quality of the results has been estimated at different space-time scales • It allows users to integrate at the space-time scales of interest for them • Further validations and intercomparisons will take place with the full AMMA surface validation network operating in 2006 • The method remains basically an MSG IR algorithm. Although using a set of channels, it cannot detect very high rainfall rates on short time periods. The duration and extension of events is overestimated, while the max intensities are underestimated. • The method is presently educated by the TRMM radar, and tuned to GPCP monthly accumulations. Other data sets may replace these entries (passive microwave, surface networks) • The method is transferable for practical applications. This is of particular interest for African institutions. Tests have to be performed over other regions covered by MSG or equivalent satellites. • The education through a space radar is efficient. A new precip radar in tropical orbit would be useful after TRMM… IPWG, M. Desbois, AMMA, Melbourne, October 2006
IR Temperature indicator: 10.8 µm IR multichannel indicators: 10.8 µm - 6.2 µm 10.8 µm - 7.3 µm 10.8 µm - 8.7 µm 10.8 µm - 9.7 µm 10.8 µm - 12.0 µm 10.8 µm - 13.4 µm Temporal difference indicator: 10.8 µm - previous 10.8 µm Local variance indicators: Variance 5x5 6.2 µm Maximum 5x5 6.2 µm Variance 5x5 10.8 µm Maximum 5x5 10.8 µm Geographic indicators: Altitude derived from SRTM data The 13 MSG neural networks inputs IPWG, M. Desbois, AMMA, Melbourne, October 2006