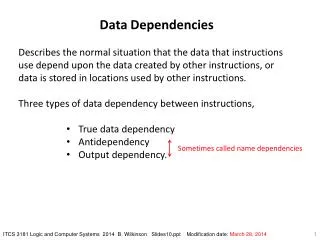
Generalizing Correlation: Analyzing Attribute Interactions in Machine Learning
This research presents a novel approach to generalizing the notion of "correlation" beyond two variables to encompass three or more variables by utilizing Shannon's entropy to quantify interaction among attributes. The findings, applicable primarily in supervised learning, reveal deeper insights into machine learning mysteries through the exploration of higher-order dependencies. By employing visualization techniques such as interaction graphs and dendrograms, the study highlights how combining multiple attributes can either create synergy or redundancy in predictive models, improving feature selection and model performance.

Generalizing Correlation: Analyzing Attribute Interactions in Machine Learning
E N D
Presentation Transcript
Analyzing Attribute Dependencies Aleks Jakulin & Ivan Bratko Faculty of Computer and Information Science University of Ljubljana Slovenia
Overview • Problem: • Generalize the notion of “correlation” from two variables to three or more variables. • Approach: • Use the Shannon’s entropy as the foundation for quantifying interaction. • Application: • Visualization, with focus on supervised learning domains. • Result: • We can explain several “mysteries” of machine learning through higher-order dependencies.
label C importance of attribute A importance of attribute B attribute attribute A B attribute correlation 3-Way Interaction: What is common to A, B and C together; and cannot be inferred from any subset of attributes. 2-Way Interactions Problem: Attribute Dependencies
Entropy given C’s empirical probability distribution (p = [0.2, 0.8]). H(C|A) = H(C)-I(A;C) Conditional entropy --- Remaining uncertainty in C after knowing A. H(A) Information which came with knowledge of A H(AB) Joint entropy I(A;C)=H(A)+H(C)-H(AC) Mutual information or information gain --- How much have A and C in common? Approach: Shannon’s Entropy A C
Interaction Information I(A;B;C) := I(AB;C) - I(A;C) - I(B;C) = I(A;B|C) - I(A;B) • (Partial) history of independent reinventions: • McGill ‘54 (Psychometrika) - interaction information • Han ‘80 (Information & Control) - multiple mutual information • Yeung ‘91 (IEEE Trans. On Inf. Theory) - mutual information • Grabisch&Roubens ‘99 (I. J. of Game Theory) - Banzhaf interaction index • Matsuda ‘00 (Physical Review E) - higher-order mutual inf. • Brenner et al. ‘00 (Neural Computation) - average synergy • Demšar ’02 (A thesis in machine learning) - relative information gain • Bell ‘03 (NIPS02, ICA2003) - co-information • Jakulin ‘03 - interaction gain
Properties • Invariance with respect to attribute/label division: I(A;B;C) = I(A;C;B) = I(C;A;B) = = I(B;A;C) = I(C;B;A) = I(B;C;A). • Decomposition of mutual information: I(AB;C) = I(A;C)+I(B;C)+I(A;B;C) I(A;B;C) is “synergistic information.” • A, B, C are independent I(A;B;C) = 0.
Positive and Negative Interactions • If any pair of the attributes is conditionally independent w/r to a third attribute, the 3-information “neutralizes” the 2-information: I(A;B|C) = 0 I(A;B;C) = -I(A;B) • Interaction information may be positive or negative: • Positive: XOR problem (A = B C) synergy • Negative: conditional independence, redundant attributes redundancy • Zero: Independence of one of the attributes or a mix of synergy and redundancy.
Applications • Visualization • Interaction graphs • Interaction dendrograms • Model construction • Feature construction • Feature selection • Ensemble construction • Evaluation on the CMC domain: predicting contraception method from demographics.
Information gain: 100% I(A;C)/H(C) The attribute “explains” 1.98% of label entropy A positive interaction: 100% I(A;B;C)/H(C) The two attributes are in a synergy: treating them holistically may result in 1.85% extra uncertainty explained. A negative interaction: 100% I(A;B;C)/H(C) The two attributes are slightly redundant: 1.15% of label uncertainty is explained by each of the two attributes. Interaction Graphs
Application: Feature Construction NBC Model Predictive perf. (Brier score)__ {} 0.2157 0.0013 {Wedu, Hedu} 0.2087 0.0024 {Wedu} 0.2068 0.0019 {WeduHedu} 0.2067 0.0019 {Age, Child} 0.1951 0.0023 {AgeChild} 0.1918 0.0026 {ACWH} 0.1873 0.0027 {A, C, W, H} 0.1870 0.0030 {A, C, W} 0.1850 0.0027 {AC, WH} 0.1831 0.0032 {AC, W} 0.1814 0.0033
Alternatives TAN NBC 0.1874 0.0032 0.1849 0.0028 BEST: >100000 models {AC, WH, MediaExp} GBN 0.1811 0.0032 0.1815 0.0029
Dissimilarity Measures • The relationships between attributes are to some extent transitive. • Algorithm: • Define a dissimilarity measure between two attributes in the context of the label C: • Apply hierarchical clustering to summarize the dissimilarity matrix.
uninformative attribute informative attribute information gain Interaction Dendrogram weakly interacting strongly interacting cluster “tightness” loose tight
Application: Feature Selection • Soybean domain: • predict disease from symptoms; • predominantly negative interactions. • Global optimization procedure for feature selection: >5000 NBC models tested (B-Course) • Selected features balance dissimilarity and importance. • We can understand what global optimization did from the dendrogram.
A A and B are independent. They may both inform us about C, but they have nothing in common. Assumed by: myopic feature importance measures (information gain), discretization algorithms. C B I(AB;C)=I(A;C)+I(B;C) C A and B are conditionally independent given C. If A and B have something in common, it is all due to C. Assumed by: Naïve Bayes, Bayesian networks (A C B); B A - I(A;B|C)=0 Implication: Assumptions in Machine Learning
Work in Progress • Overfitting: the interaction information computations do not account for the increase in complexity. • Support for numerical and ordered attributes. • Inductive learning algorithms which use these heuristics automatically. • Models that are based on the real relationships in the data, not on our assumptions about them.
Summary • There are relationships exclusive to groups of n attributes. • Interaction information is a heuristic for quantification of relationships with entropy. • Two visualization methods: • Interaction graphs • Interaction dendrograms